
International economy – October 2026
The information in these articles is current as of 1 October 2026.
Part 1: Overview
Energy markets
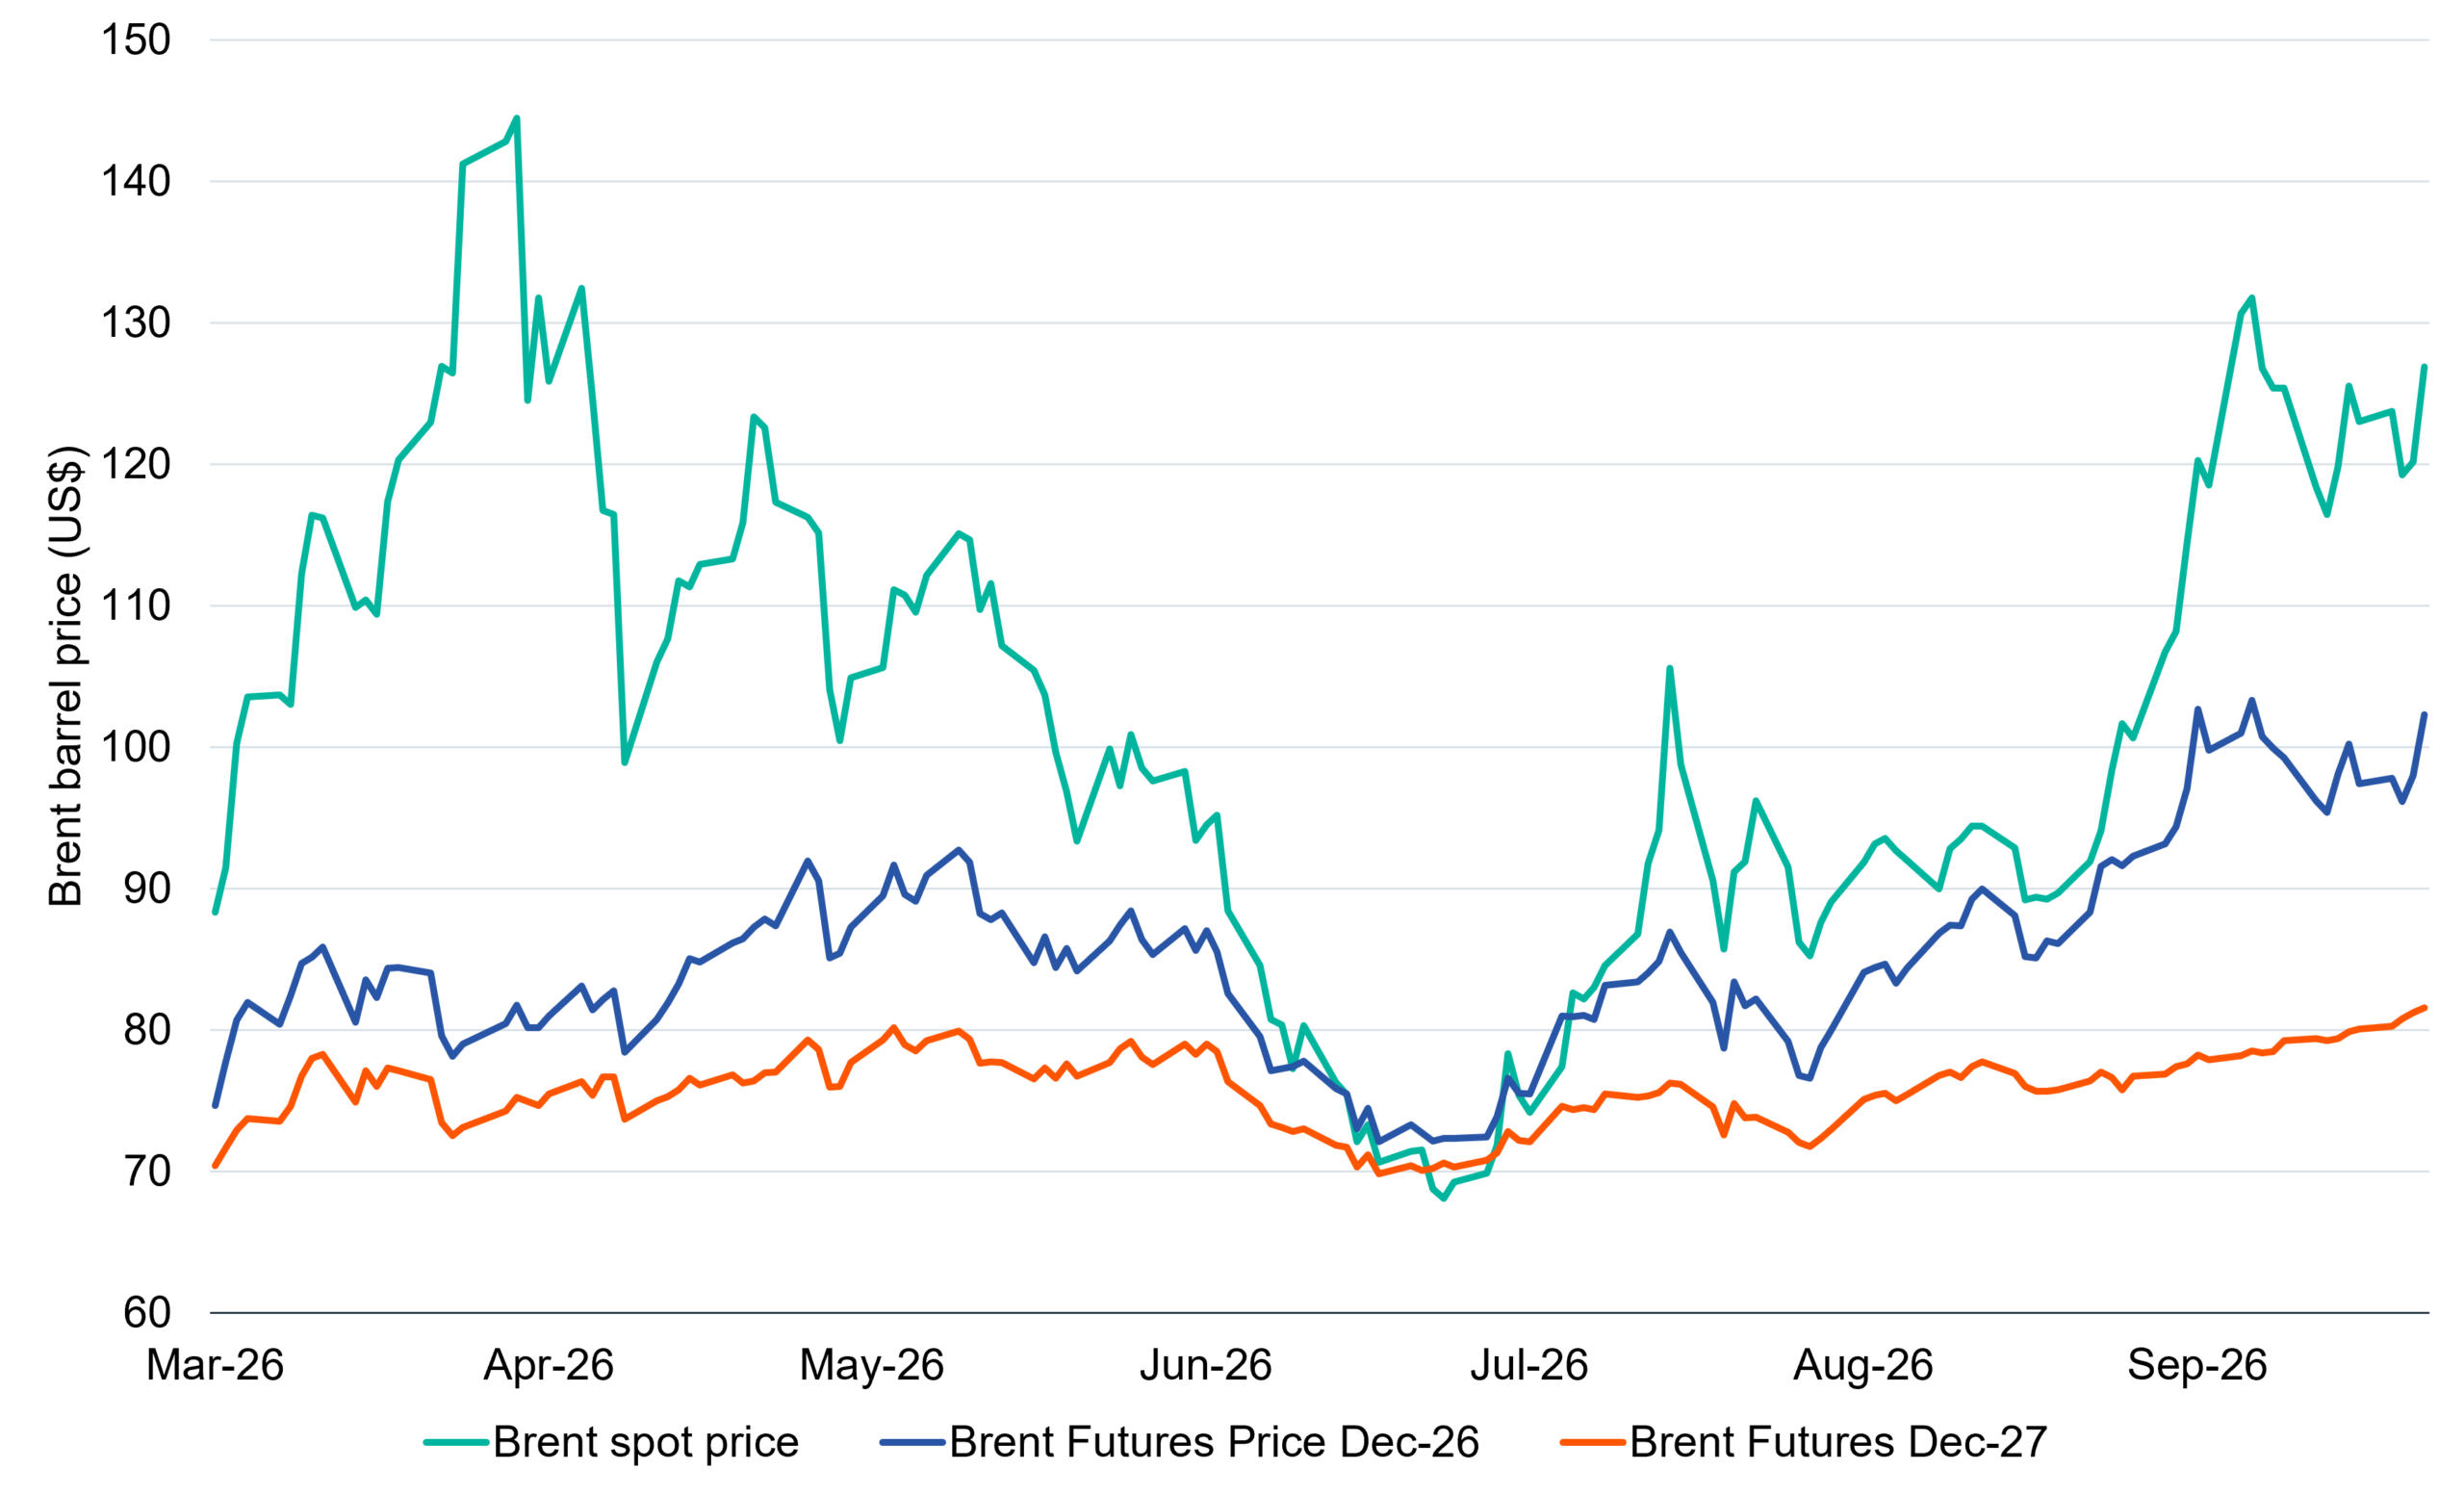
Energy markets continue to complicate the global economic picture. The challenge posed by the Strait of Hormuz lies in the continued lack of free passage. This has exerted a toll on the global economy with energy futures pricing a “higher-for-longer” scenario as Dec-27 futures (the cost of delivering oil 15 months from now) have risen almost 20% since the conflict between the US and Iran began.
The conflict has also underscored the vulnerability of downstream refined petroleum products to supply disruptions. Reports that Costco has restricted the quantity of motor oil customers can purchase[1] highlight the pressure emerging within parts of the supply chain. The risks associated with energy shocks are not always best reflected in headline crude oil prices, but rather in the prices of refined products such as diesel and jet fuel, where refinery outages and reduced processing capacity can quickly lead to significant shortages and price spikes. For a major energy producer and exporter such as the United States, the prospect of needing to ration motor oil is itself a noteworthy warning sign. Concerns are further heightened by discussions around potential restrictions on diesel exports, which could exacerbate existing supply pressures and reinforce broader energy security fears.
Brent oil – spot and futures pricing (Mar-26 to Sep-26)
Source: Bloomberg
A recent pickup in Chinese oil purchases after falling precipitously in recent months will exacerbate the challenge to the global economy. The prospect of a second crucial waterway, the Red Sea, being shut down by Houthi forces in Yemen has been a key driver of the recent price uptick. It highlights the challenges facing the US to resolve the conflict.
On that note, a formal resolution appears increasingly out of reach with negotiations behind the scenes yielding little result. On the positive side, it appears US escorts are helping an increased flow of traffic exit the Strait, with US military authorities citing an unconfirmed billion barrels escorted out in the two months to 19 September[2]. The Saudi pipeline to the Red Sea had also served a useful function in offsetting the closure of the Strait. This must be balanced however by the ongoing economic blockade of Iran, which is a net negative to global supply.
We do not see a straightforward path to resolve the conflict. Iran’s demonstrated ability to absorb significant economic hardship, and civilian disruption suggests the prospect of a negotiation compromise remains limited. The depletion of US energy stockpiles could be a driver as we near the peak-demand winter season but even this is speculative. The path of least resistance appears to be an ongoing tit-for-tat between the US and Iran as energy markets gradually tighten. This should be a headwind to the global economy, but mitigation measures in the form of the Saudi pipeline and naval escorts may help cushion the impact.
United States
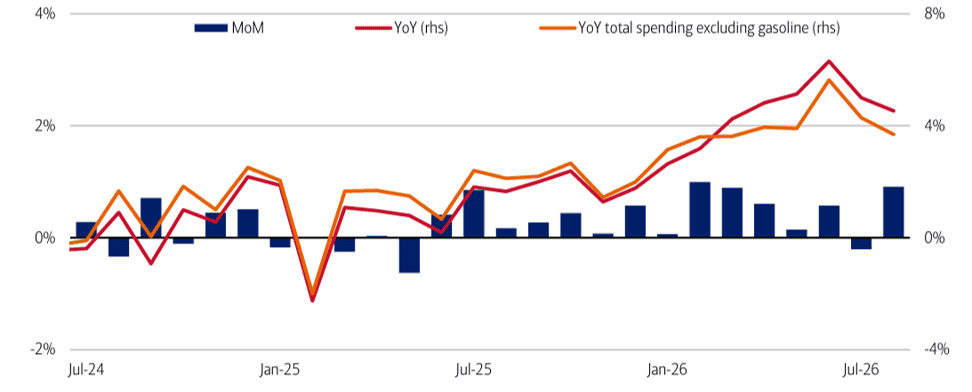
The US economy continues expanding at an impressive rate given its scale rising 1.5% at an annualised rate in the June quarter or 2.1% for the year to June. Consumer spending has been a key feature, accelerating to 3.4% over the same period. Early indications suggest this momentum has carried into the September quarter, with Bank of America card spending data pointing to continued strength in consumer activity. While headline spending figures have been supported by higher fuel prices, the underlying trend remains robust.
Total card spending per household (Jul-24 to Aug-26)
Source: Bank of America Consumer Checkpoint[3]
AI-led investment remains an important growth driver. Information processing and equipment investment spending contributed a full percentage point of the economy’s 2.1% annual growth to June.
The downside of current growth has been the resurgence of inflationary pressures. The energy shock from the Middle East conflict has had a flow on impact in the US particularly in the cost of diesel and other refined fuels. Moreover, underlying inflation (using the Federal Reserve’s preferred measure of Core PCE) has remained elevated at 3.3% for the year to July, well above the long-term target of 2%. The latest Markit PMI data also highlights the challenge of increasing pent-up demand with business backlogs rising sharply. This suggests firms may face increasing capacity constraints and could respond by exercising greater pricing power, particularly against a backdrop of higher fuel, freight and transportation costs[4]. Together, these factors point to the potential for inflation to remain more persistent than policymakers would prefer.
Rising oil prices were a key factor behind newly appointed Federal Reserve Chair Kevin Warsh’s decision to lift the federal funds rate to 3.875% in September. While inflation remains elevated, the Fed also highlighted the continued strength of economic activity and signs of improving productivity[5]. Such strong growth is likely to sustain inflationary pressures in the short run until these investments generate sufficient productivity gains to offset rising demand. Market consensus currently anticipates at least one further rate increase before year-end, with the possibility of additional tightening if geopolitical tensions prevent energy prices from stabilising.
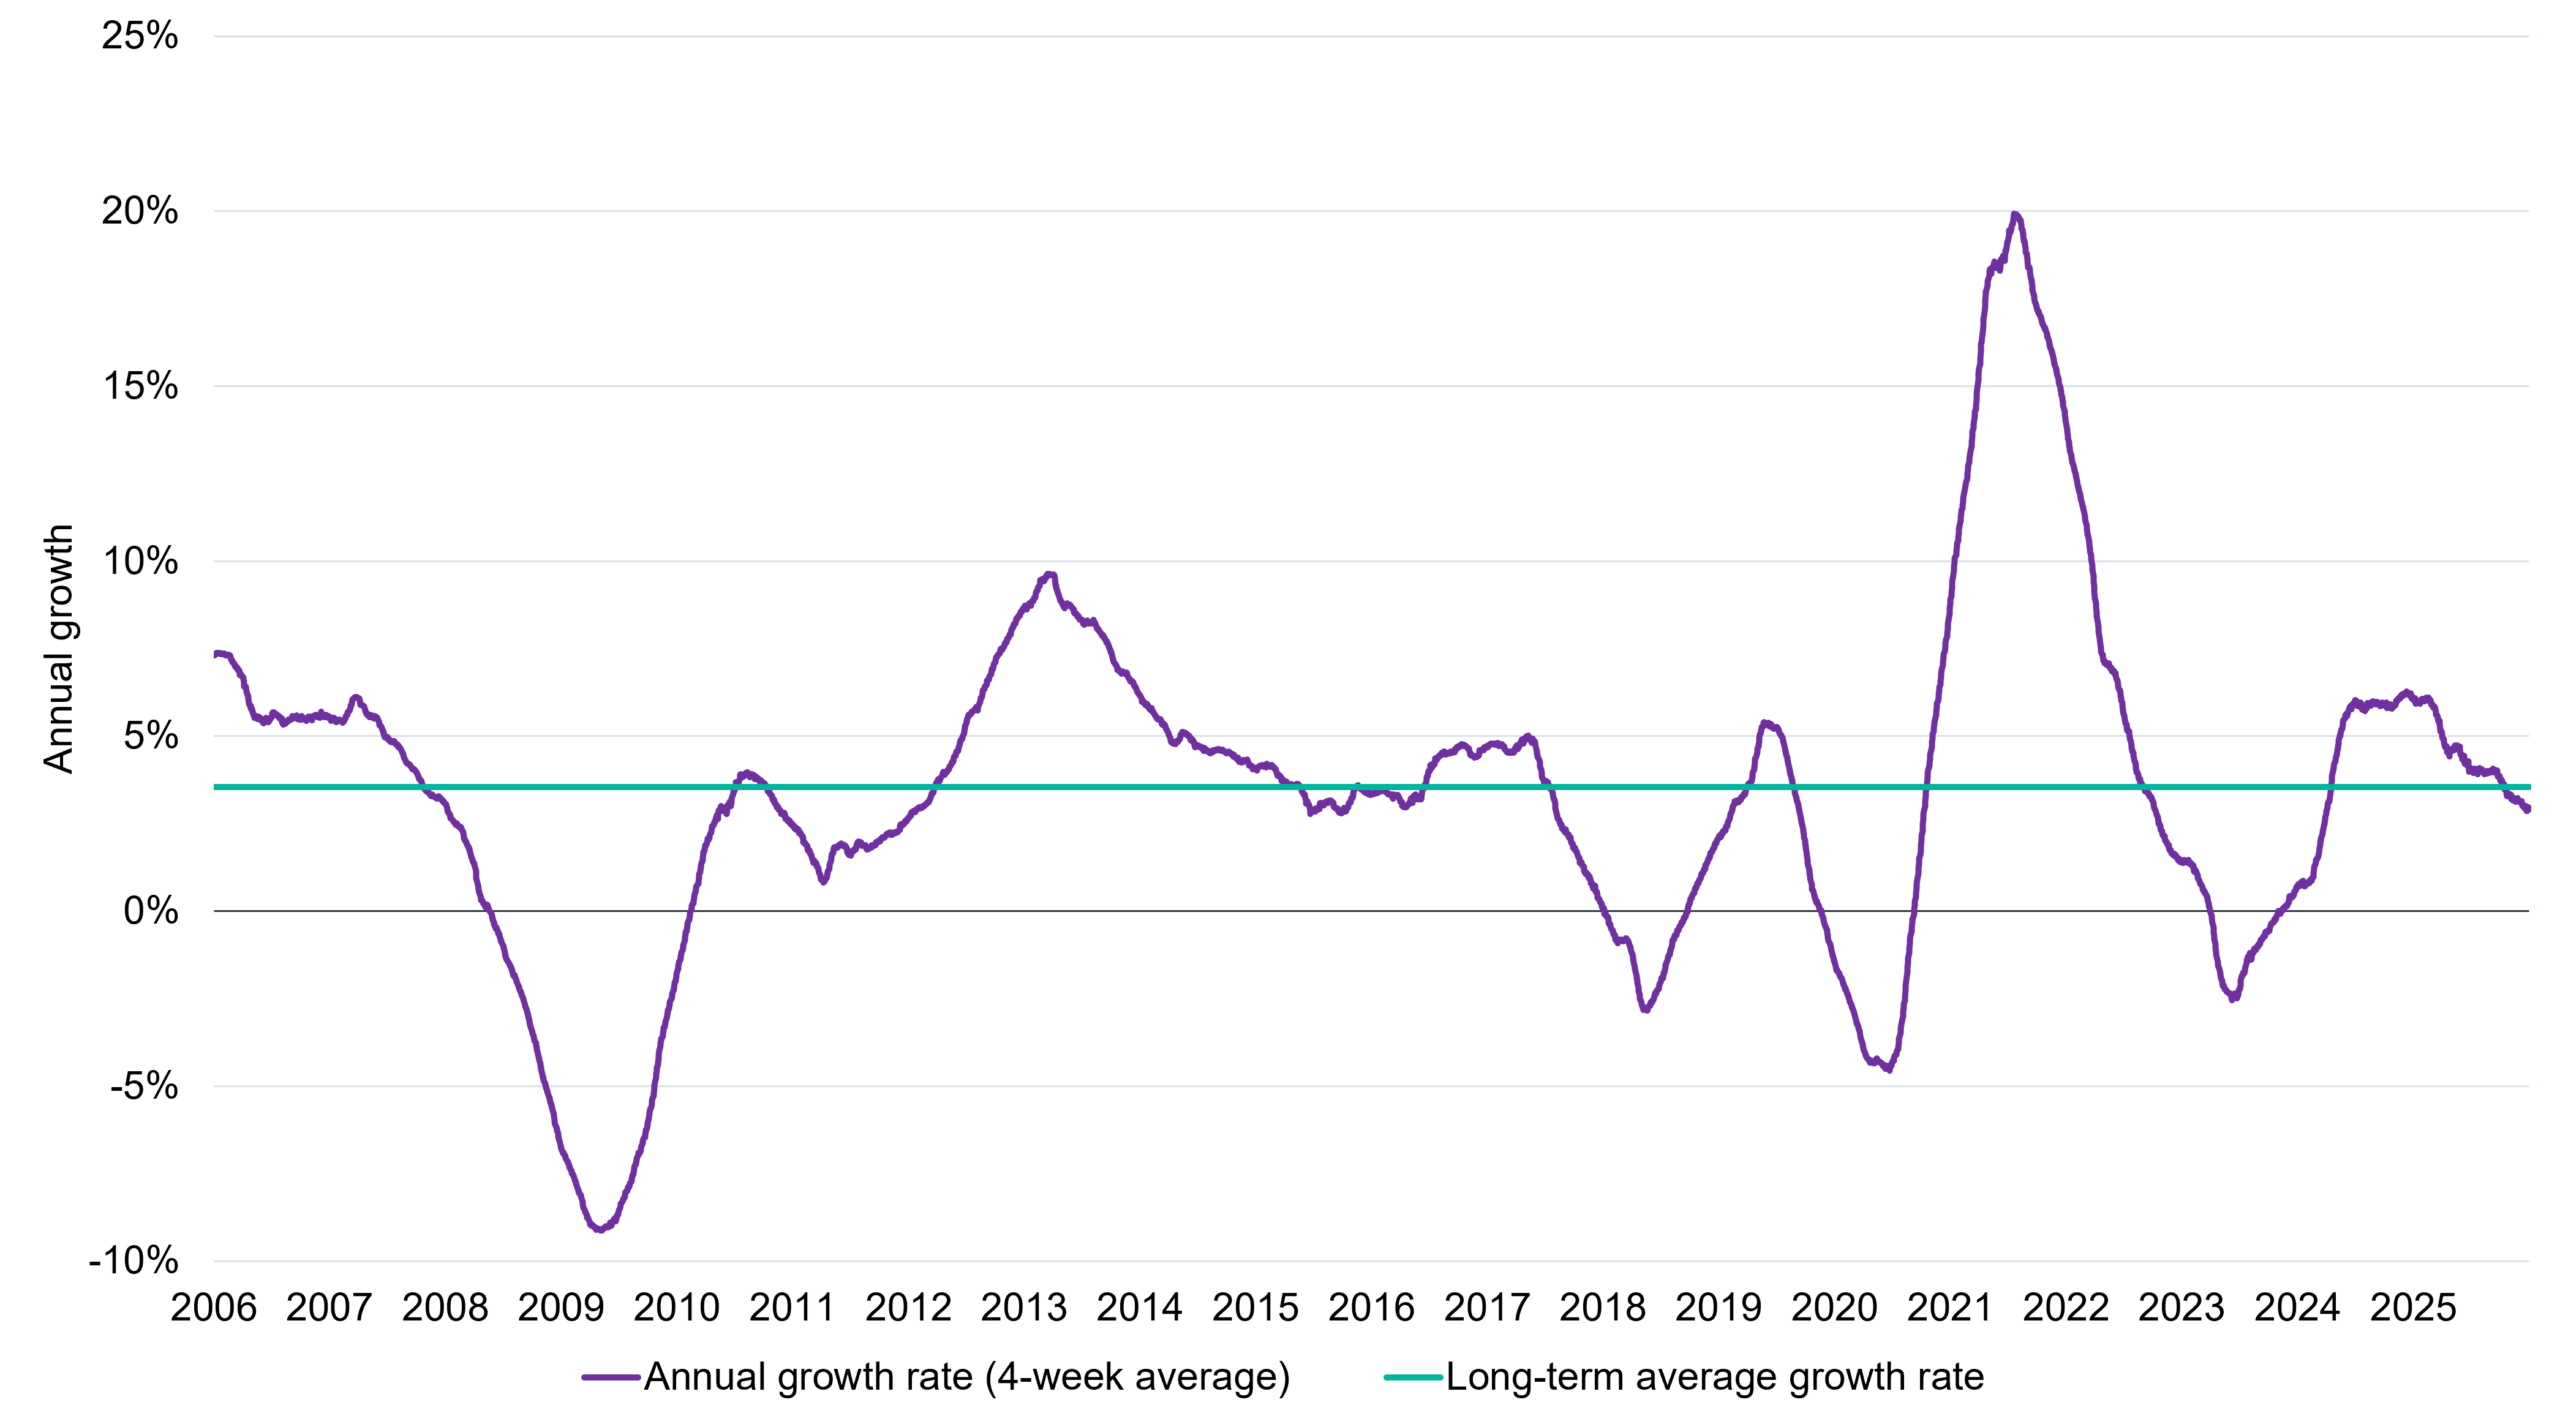
Despite robust growth in AI infrastructure and associated industries, there is evidence emerging that the higher interest rate environment is starting to have an impact. The household savings rate has slipped to 3% in July, well down from its prior high of 6.4% in early 2024. Tax receipts for workers have also seen a notable slowdown in growth according to US Treasury data. These factors suggest that not only are savings are being eroded but the labour market is cooling, which point towards a potential moderation in growth in the months ahead.
US Federal Income tax collections annual growth rate (Sep-06 to Sep-26)
Source: US Treasury, PPSPW calculations
On balance, the US continues to be an attractive growth market, albeit one accompanied by a meaningful inflationary drag. Downside risks do not appear excessive, and we expect the ongoing AI investment boom to continue supporting economic activity in the near term.
Eurozone
Imported inflation driven by higher energy prices remains the primary concern for Eurozone economies. Headline inflation accelerated to 3.3% over the year to August, while core inflation rose a more modest 2.4%. Elevated oil prices are also beginning to feed through to broader production costs, with producer price inflation surprising to the upside at 5.8% over the year to July.
At the same time, the sustainability of economic growth is increasingly being questioned given the headwinds posed by higher interest rates. Retail sales growth slowed sharply to just 0.6% over the year to July. Once adjusted for inflation, this suggests a contraction in real sales volumes over the period. Industrial production has also remained subdued, with output broadly flat over the year to July. In real terms, this implies many industrial businesses likely experienced declining sales volumes in a shrinking market. It also highlights the growing competitive pressures from offshore producers, particularly in sectors such as automotive manufacturing. In response, European authorities are increasingly adopting a more assertive trade stance, including the use of tariffs and other measures aimed at supporting domestic industries[6].
More encouragingly, forward-looking indicators have shown a notable improvement. The S&P Global PMI survey reported services activity at a 10-month high and manufacturing output at a 55-month high in September. As a result, the Composite PMI rose to 53.1, its strongest reading since 2021. France recorded an expansion in activity for the first time in almost a year, while Germany, the bloc’s largest economy, appears to be experiencing its strongest growth period in several years. Demand related to artificial intelligence, particularly in semiconductors, together with increased defence spending and continued strength in the services sector, have been important contributors to this improvement.
The European Central Bank (ECB) remains a key risk to this developing recovery. The ECB increased its policy rate by a further 0.25% in September in response to a higher projected inflation outlook. The central bank’s primary mandate is to maintain price stability, targeting inflation of 2% over the medium term, rather than supporting employment outcomes. Importantly, the ECB also upgraded its economic growth forecasts, suggesting policymakers believe the economy can absorb higher interest rates without experiencing a material deterioration in activity.
Overall, the Eurozone economy has demonstrated greater resilience than many anticipated, particularly given its dependence on imported energy. The recent improvement in growth despite elevated energy prices represents a significant contrast to the challenges experienced in 2022. While inflation remains above target, there appears to be scope for the current growth recovery to continue in the near term, even in the face of additional monetary tightening by the ECB.
China
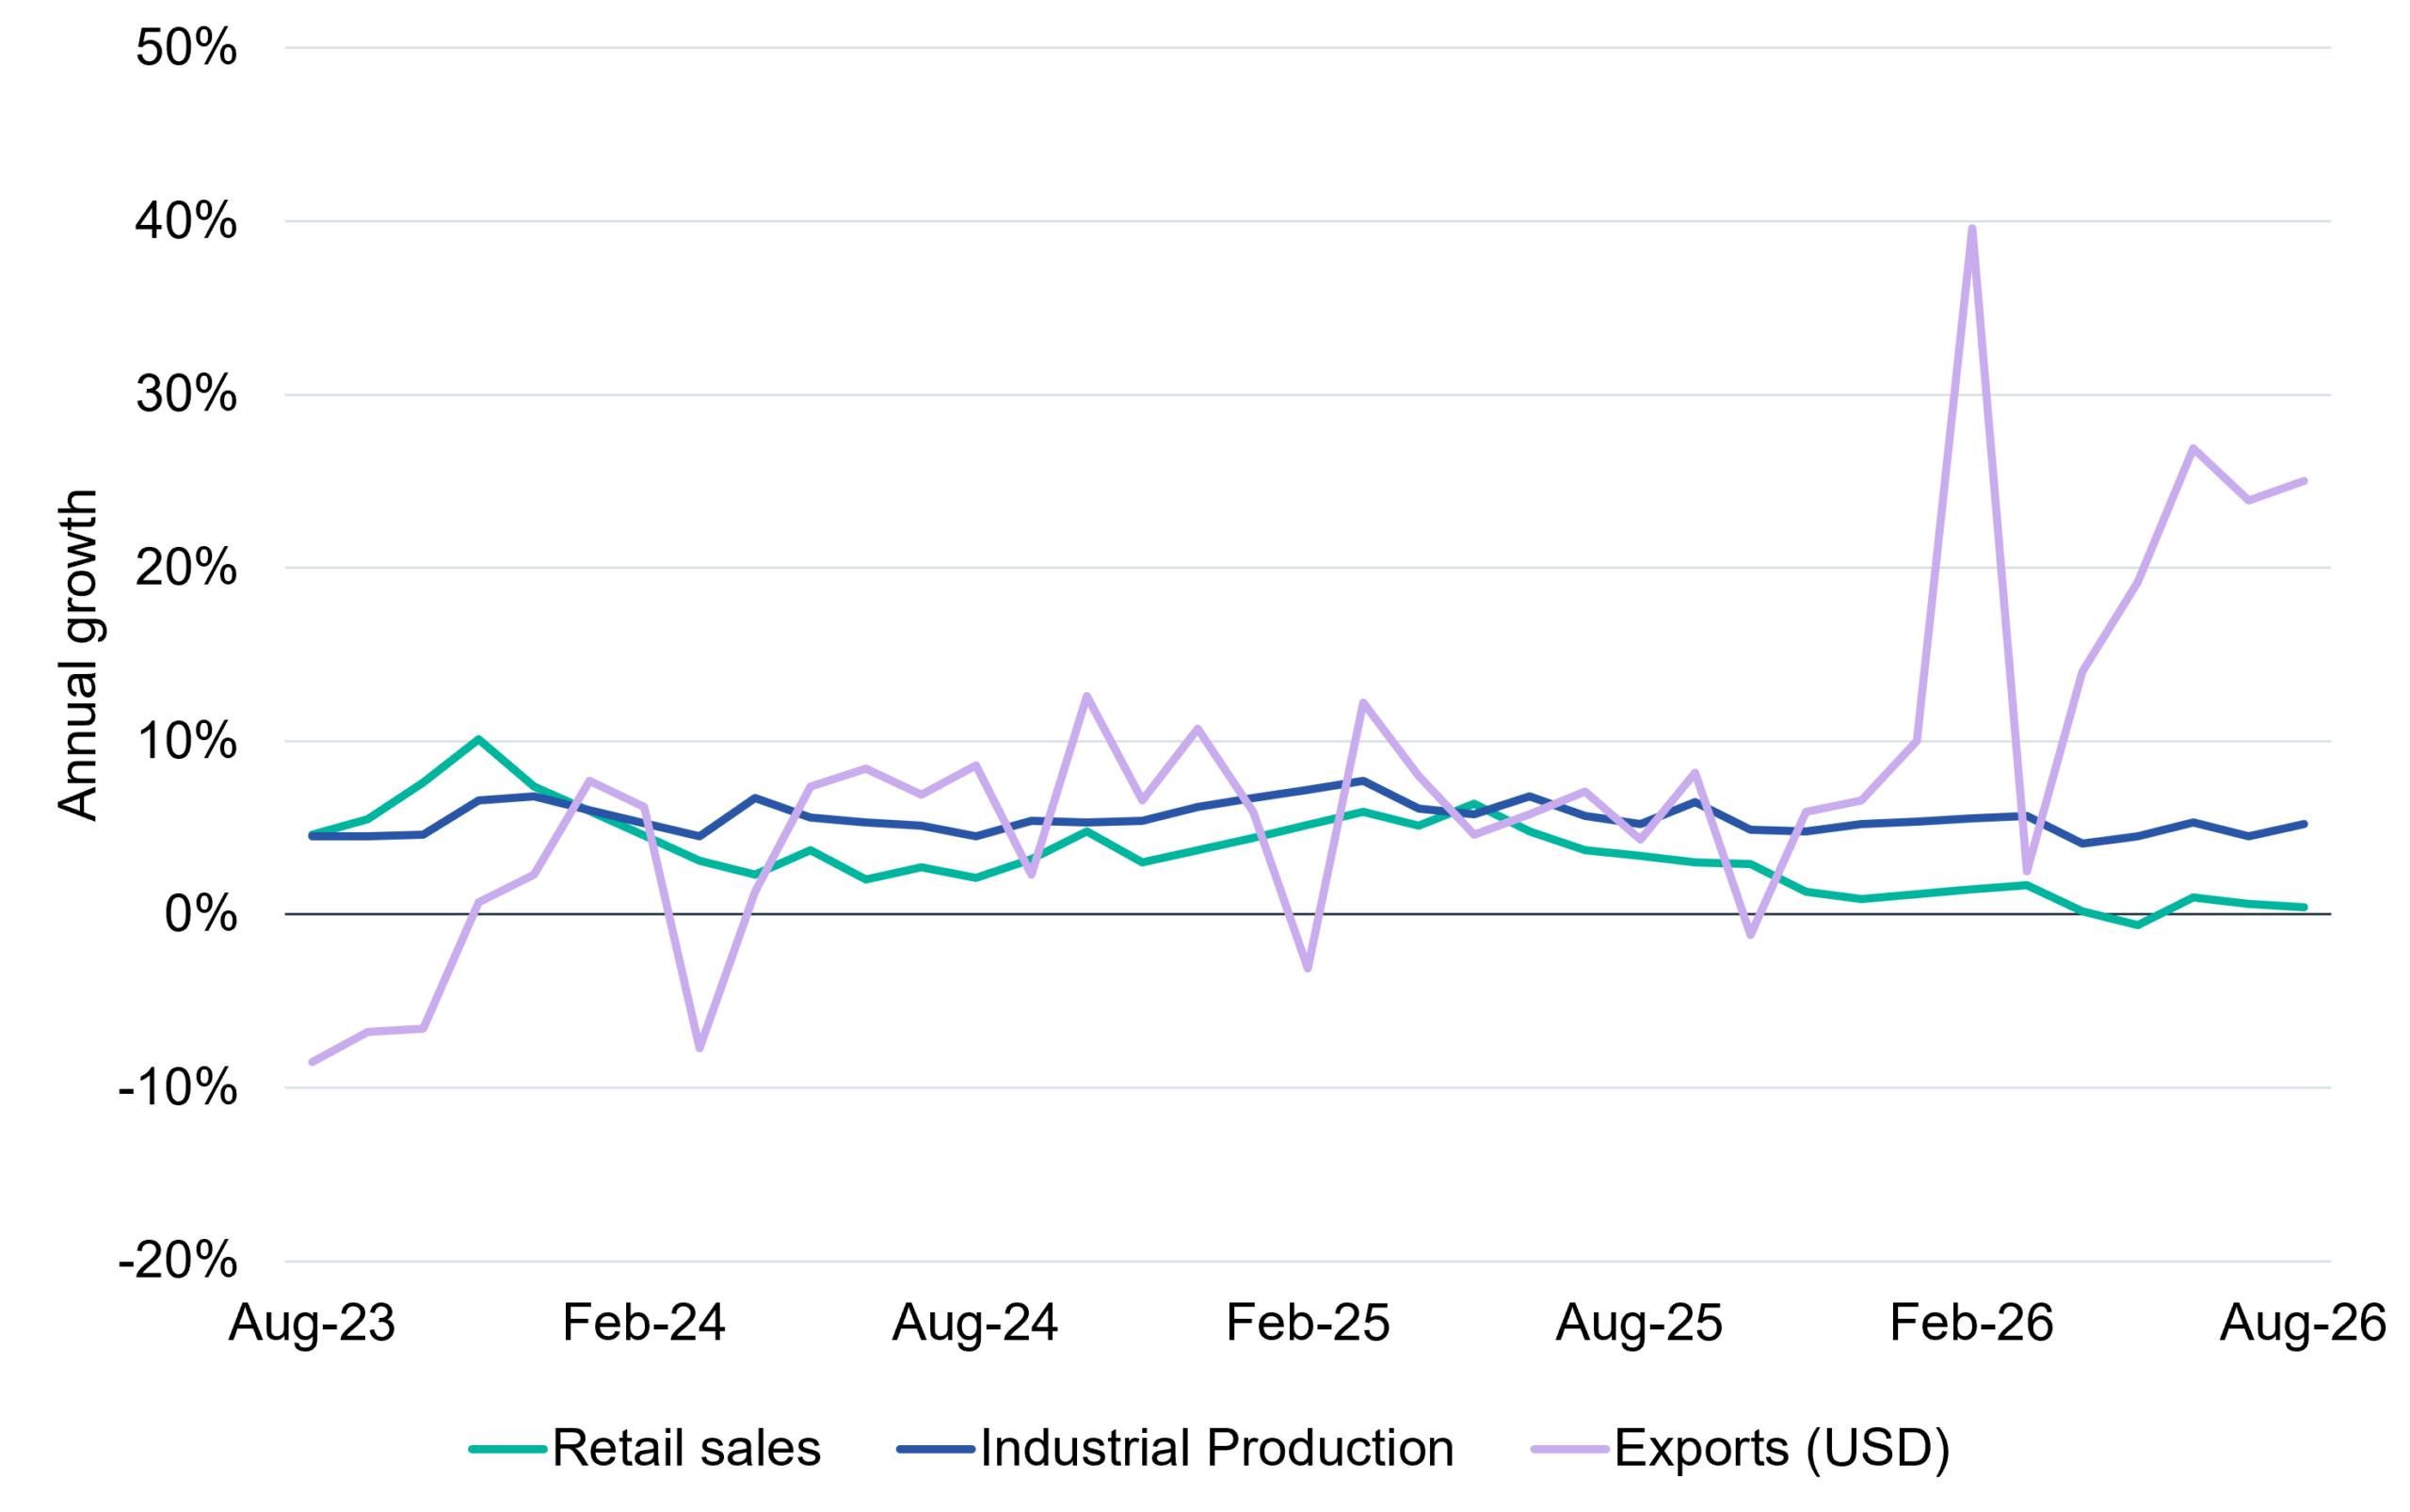
The Chinese economy continued to lose momentum through the second half of the year, with GDP growth slowing to 4.3% year-on-year in the June quarter, its weakest quarterly outcome since late 2022. The imbalance between domestic demand and the economy’s productive capacity has widened further. Industrial production grew by 5.2% over the year to August, accelerating from 4.5% in July and comfortably exceeding consensus expectations of 4.8%. In contrast, retail sales growth slowed to just 0.4% over the year to August, implying a decline in real consumption once inflation is taken into account. Fixed asset investment also remained under pressure, falling 7.2% in the eight months to August compared with the corresponding period in 2025.
Annual growth in key Chinese economic sectors (Aug-23 to Aug-26)
Source: Bloomberg, PPSPW calculations.
Export-led growth remains key to the economy’s fortunes. Exports grew 25% year on year in August driven by high-tech and AI-related goods with imports growing even faster at 28.2%[7]. The trade surplus widened further to US$119.09bn or over US$800bn in the first eight months of the year cumulatively. In a recent US summit, we saw President Xi and President Trump agreed to cut tariffs on US$30bn of goods[8] suggesting some thawing of relations. We do not expect this to resolve other, larger disputes on trade or rivalry in high-tech sectors such as AI, however. Both nations remain at fundamental odds in their pursuit of technological dominance. Symbolic gestures to buy agricultural goods will do little to bridge the gap.
Chinese policymakers have pledged stronger policy support to meet the national growth target of 4.5% – 5% this year. The country’s State Council has called for the acceleration of government bond issuance and usage as part of this initiative as well as more targeted policy. This includes interest rate subsidies, infrastructure upgrades as well as expanded facilities to facilitate technology innovation and industrial upgrading[9]. While these commitments are encouraging, policy support has historically tended to be limited in scope, leaving external demand and export growth to play a disproportionately large role in sustaining overall economic activity.
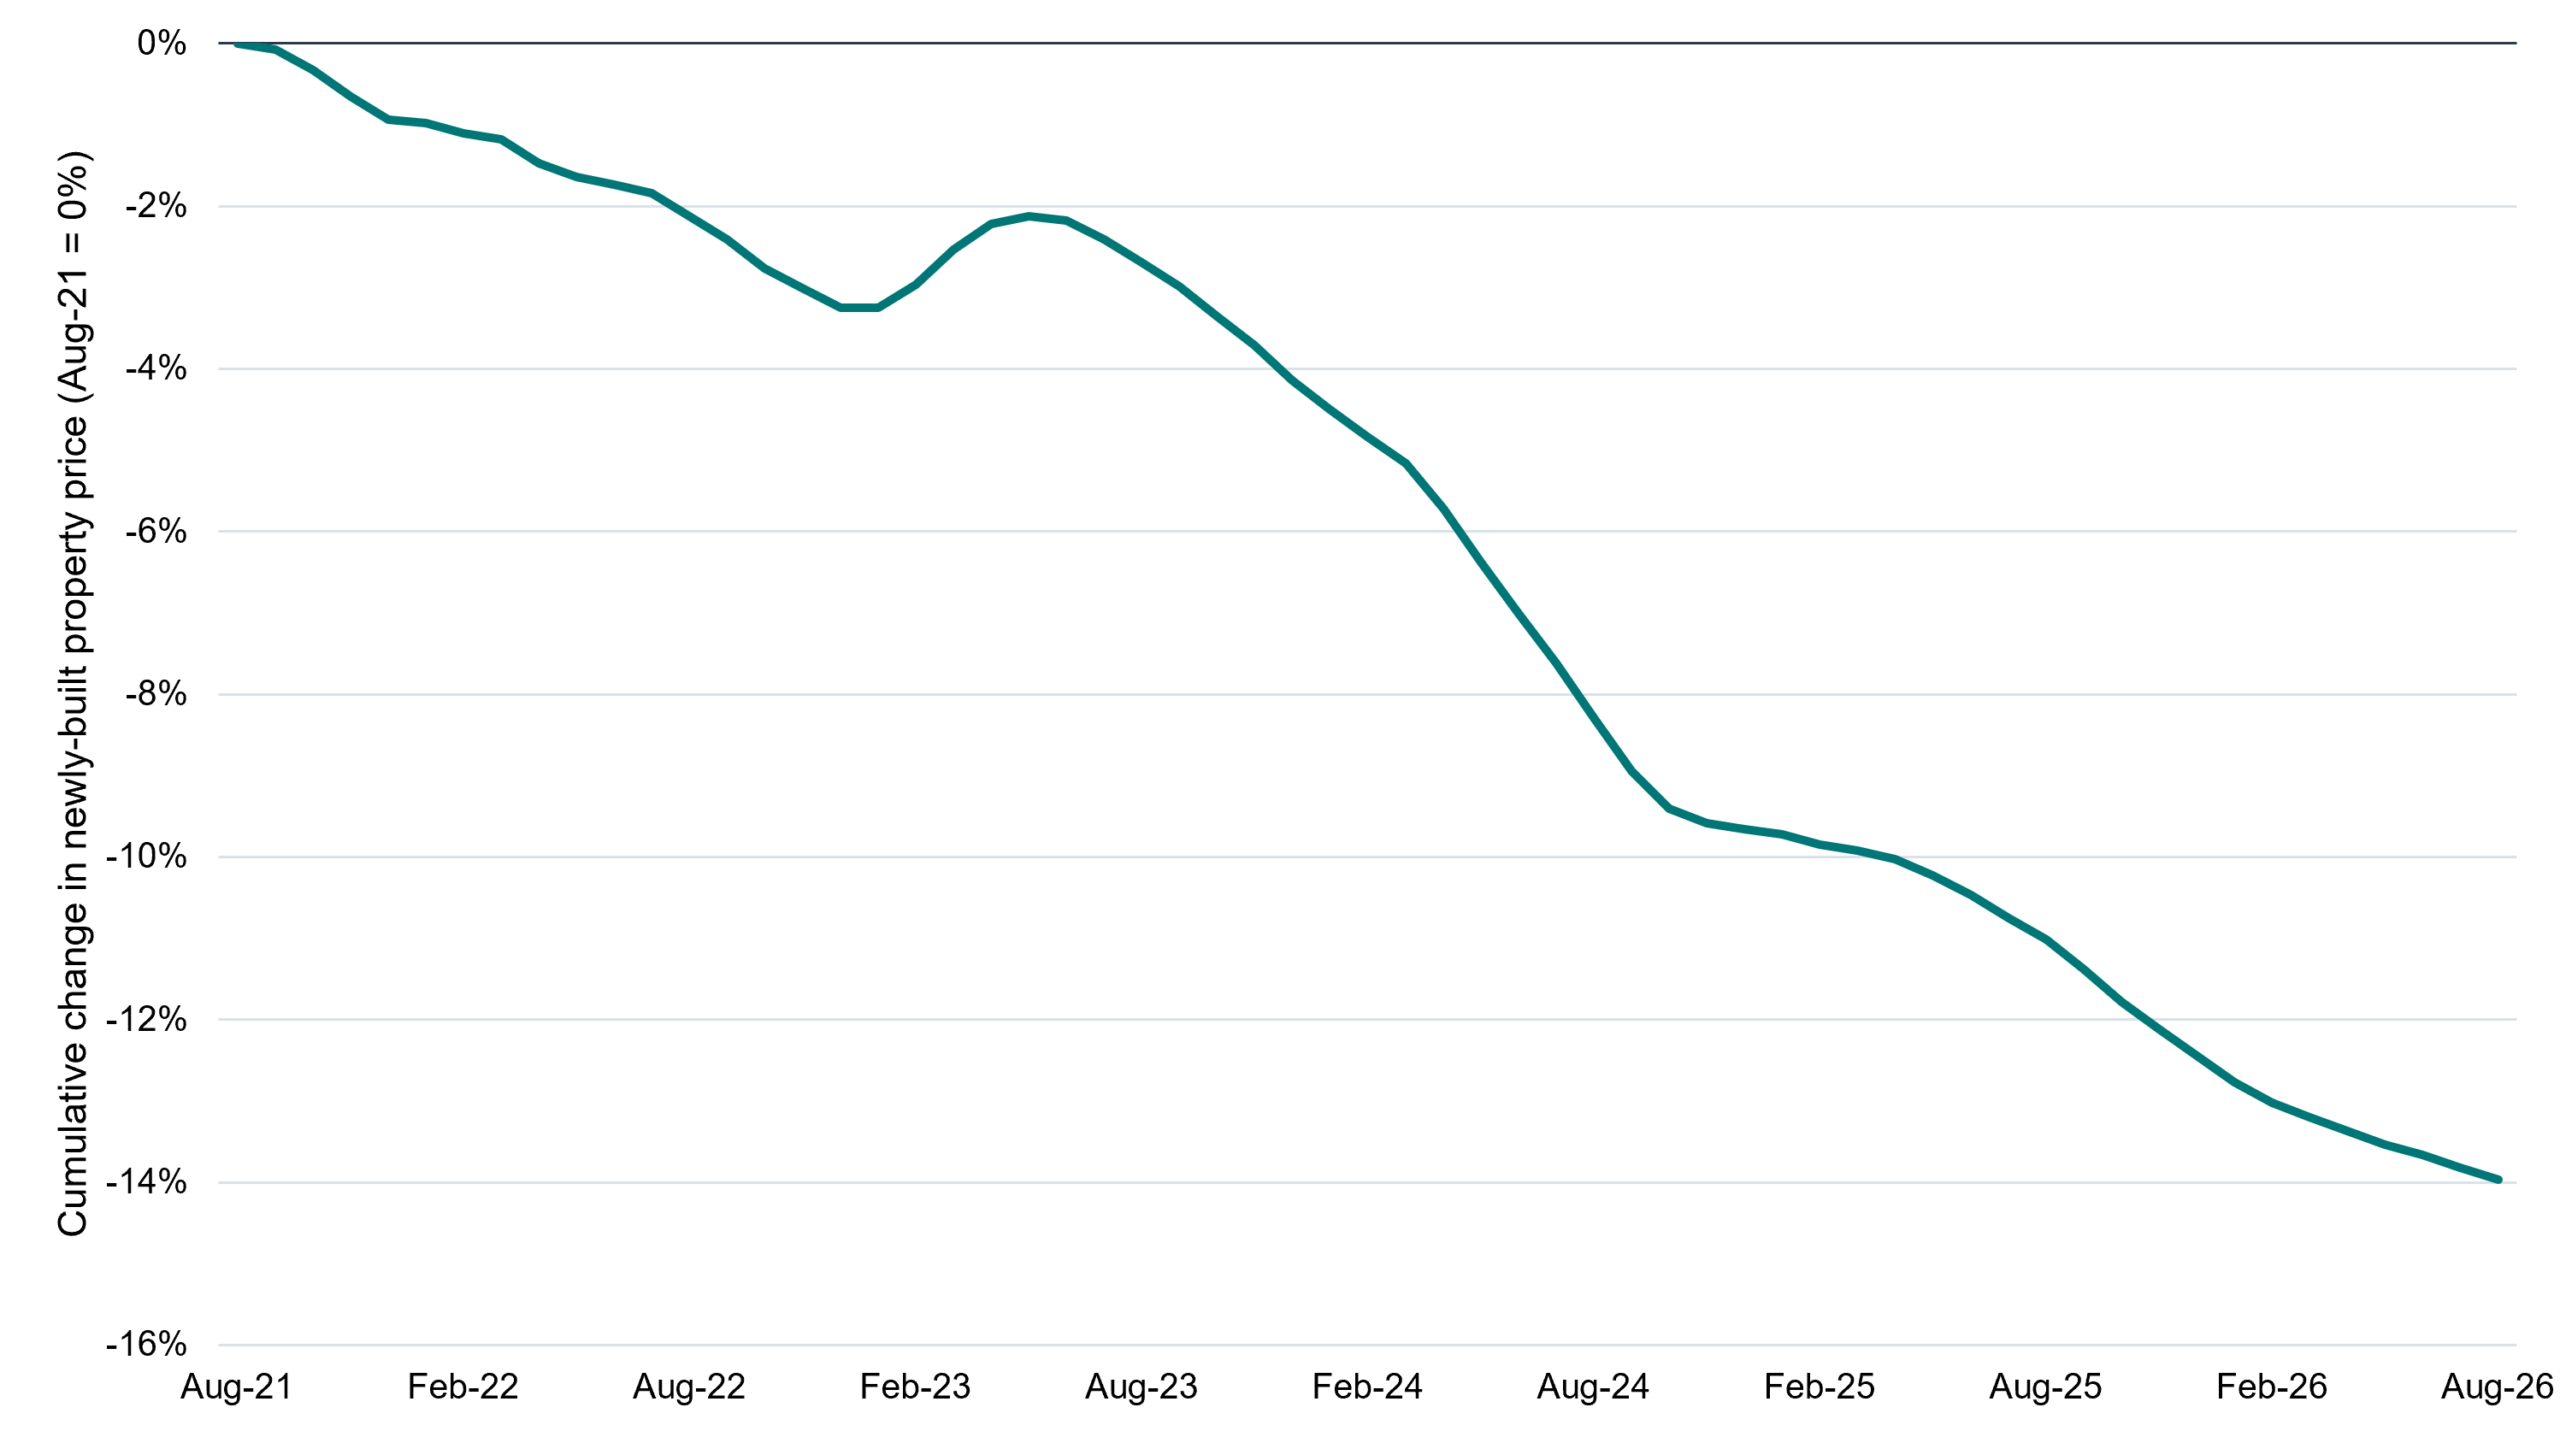
Cumulative change in newly built property prices for major Chinese cities (Aug-21 to Aug-26)
Source: Bloomberg Intelligence, PPSPW calculations
Ultimately, we expect Chinese growth to continue slowing. Genuine consumer-led policies such as improving social welfare and direct-to-consumer grants are needed to create a better mix of growth sources. Official policy pronouncements echo this such as the country’s latest 5-year Plan[10]. Actual performance to date remains lacking with the country needing to intervene to offset the destruction of trillions in value from the weakness in its property market.
Conclusion
US exceptionalism remains a hallmark of the global economy with pleasing signs of improvement in Europe. The easing of shipping restrictions in the Middle East coupled with proactive central bank tightening should help contain inflationary pressures. The prospect of targeted stimulus in China could mark an inflection in the domestic growth slowdown we have seen there to date. Demand remains resilient, led by the US, which sees us maintain an optimistic view on global growth for the near-term.
Part 2: Key economic indicators
United States
| Economic snapshot | Last reported result | Date | 2026e | 2027e |
| Growth (GDP) | 2.1% | Jun-26 | 2.1% | 2.1% |
| Inflation | 3.5% | Aug-26 | 3.3% | 2.4% |
| Interest rates | 3.9% | Sep-26 | 3.6% | 3.5% |
| Unemployment rate | 4.1% | Aug-26 | 4.3% | 4.3% |
| Composite PMI | 58.4 | Sep-26 |
Eurozone
| Economic snapshot | Last reported result | Date | 2026e | 2027e |
| Growth (GDP) | 1.2% | Jun-26 | 1.0% | 1.3% |
| Inflation | 3.2% | Aug-26 | 3.5% | 2.0% |
| Interest rates | 2.3% | Sep-26 | 2.7% | 2.5% |
| Unemployment rate | 6.4% | Jul-26 | 6.4% | 6.2% |
| Composite PMI | 53.1 | Sep-26 |
China
| Economic snapshot | Last reported result | Date | 2026e | 2027e |
| Growth (GDP) | 4.3% | Jun-26 | 4.6% | 4.4% |
| Inflation | 0.8% | Aug-26 | 1.0% | 1.1% |
| Interest rates | 1.4% | Sep-26 | 1.3% | 1.3% |
| Unemployment rate | 5.3% | Aug-26 | 5.1% | 5.1% |
| Composite PMI | 52.1 | Aug-26 |
Japan
| Economic snapshot | Last reported result | Date | 2026e | 2027e |
| Growth (GDP) | 0.9% | Jun-26 | 0.8% | 0.8% |
| Inflation | 1.9% | Aug-26 | 2.0% | 2.1% |
| Interest rates | 1.3% | Sep-26 | 1.3% | 1.8% |
| Unemployment rate | 2.5% | Jun-26 | 2.5% | 2.5% |
| Composite PMI | 52.5 | Sep-26 |
Source: Bloomberg
[1] ‘Costco is rationing oil. That should worry global investors’, Australian Financial Review (21 September 2026), Costco rationing oil should worry global investors in sharemarkets and bond markets, (accessed 23 September 2026).
[2] M. Bhakta, ‘Centcom: More than 1B crude oil barrels passed through Hormuz strait in recent months’, The Hill (19 September 2026), Centcom: U.S. protected 1B barrels of oil in Hormuz, (accessed 22 September 2026).
[3] ‘Consumer Checkpoint: Stil sizzling’, Bank of America Institute (14 September 2026), Consumer Checkpoint: Still sizzling, (accessed 16 September 2026).
[4] ‘S&P Global US Flash PMI’, S&P Global (23 September 2026), S&P Global Flash US PMI , (accessed 24 September 2026).
[5] ‘Federal Reserve press release’, Federal Reserve (16 September 2026), Federal Reserve issues FOMC statement, (accessed 18 September 2026).
[6] N. Barkin, ‘Watching China in Europe – October 2026’, Watching China in Europe (28 September 2026), Watching China in Europe – October 2026 – by Noah Barkin, (accessed 29 September 2026).
[7] Y. Zhang and L. Lee, ‘China’s exports surge as demand for high-tech, AI help prop up economic growth’, Reuters (8 September 2026), China’s exports surge as demand for high-tech, AI help prop up economic growth | Reuters, (accessed 12 September 2026).
[8] ‘China’s industrial profit growth slows further as economic imbalances deepen’, Reuters (28 September 2026), China’s industrial profit growth slows further as economic imbalances deepen | Reuters, (accessed 29 September 2026).
[9] ‘China’s cabinet pledges stronger policy support to meet growth target’, The Standard (28 September 2026), China’s cabinet pledges stronger policy support to meet growth target, (accessed 30 September 2026).
[10] ‘China unveils measures to expand, upgrade consumer goods consumption’, Xinhua (31 August 2026), China unveils measures to expand, upgrade consumer goods consumption, (accessed 2 September 2026).