Overview
Most Australian stocks reported for the financial year ending June 2026 in August. The market dynamics were stark with most companies struggling to beat consensus expectations on revenue growth. Conversely, most sectors were able to exceed profit forecasts through a combination of cost control and leveraging higher pricing for their products with Industrials and Real Estate the notable exceptions.
The Industrials sector was impacted heavily by weaker earnings for the likes of Qantas (QAN) where higher fuel costs dragged on profitability. Meanwhile Real Estate weakness could be attributed in part to the impairment of Pexa Group’s core Australian business following an adverse regulatory driving that would constrain pricing power materially. In addition, some of the “beats” versus consensus reflect one-off investment gains e.g. Pro Medicus (PME) that are unlikely to be repeated but serve to inflate a particular financial year’s results. The converse is true with impairments that in the Pexa (PXA) case depress earnings for this reporting season.
Australian market sector surprises versus consensus for sales and earnings
|
Surprise |
| Sector |
Sales |
Earnings |
| Financials |
-1.0% |
+1.8% |
| Materials |
+1.4% |
+44.0% |
| Health Care |
+0.8% |
+1.0% |
| Consumer Discretionary |
-1.9% |
+1.1% |
| Industrials |
-1.1% |
-14.5% |
| Real Estate |
+0.6% |
-3.6% |
| Communication Services |
-0.3% |
+5.8% |
| Consumer Staples |
-0.0% |
+3.1% |
| Energy |
-2.6% |
+9.0% |
| Info Technology |
+2.2% |
+53.0% |
| Utilities |
-2.3% |
+0.2% |
| Australian market |
-0.1% |
+17.5% |
Source: Bloomberg
The actual earnings results can carry the day in terms of performance, but what is typically more pertinent is the outlook as investors look ahead to future growth and profitability conditions. Macroeconomic conditions are also relevant. Australian companies do not operate in a vacuum with many sensitive to offshore economic and market forces in dictating overall performance. In trying geopolitical periods these macroeconomic concerns can loom large and cause outsized impact on relative performance which we arguably saw during August.
The weakness in Consumer Discretionary stocks was a case in point. Disappointing guidance at a company level also encountered growing expectations for interest rate hikes being necessary to combat inflation. This saw a material share price correction as the two factors reinforced an overall negative outlook. Likewise for Real Estate even though the sector outlook was modestly upgraded (FY27 EPS up 0.4% versus early August expectations) the sensitivity to higher interest rates given the reliance on leverage weighed on overall performance.
In Materials we had a reverse scenario. Company performance was a notable support with sector giant BHP Group ahead of consensus for profitability and free cashflow allowing for a material outperformance in its final dividend, which was 22% above expectations, admittedly bolstered by asset sales. Furthermore, trader fears about prospective US tariffs on copper (the metal responsible for over half of BHP profits in FY26), saw increased stockpiling in the US that kept copper prices at near-record highs. This coupled with a recovery in gold prices on US debt concerns helped drive material sector outperformance for the month.
Australia market sector performance versus the S&P/ASX 200 Index in August 2026
| Sector |
Over/underperformance |
| Health Care |
+17.3% |
| Materials |
+10.7% |
| Utilities |
+5.9% |
| Information Technology |
+4.8% |
| Energy |
+2.4% |
| Consumer Staples |
-1.1% |
| Communication Services |
-2.9% |
| Industrials |
-3.0% |
| Financials |
-7.0% |
| Real Estate |
-8.1% |
| Consumer Discretionary |
-9.5% |
Source: Bloomberg
Notable highlights
| Company |
August Performance |
Key points |
| CSL Ltd (CSL) |
+39.4% |
- CSL confirmed guidance with FY26 revenue and underlying profits down 1% and 2% respectively.
- It was strongly rewarded by investors for suggesting a turnaround was well underway. Management guided to underlying net profit growth of 5% (ahead of expectations) as well flagging stronger outlooks above consensus for its core Behring and Seqirus divisions.
- Part of this beat against consensus forecasts is misleading, however. Management changed their preferred underlying profit calculation such that comparing on a like-for-like basis reduces expected growth to 2%.
- The share price recovery reflects a mix of depressed expectations and further valuation support in the form of a new US$1.1bn buyback for FY27, up from US$1bn in FY26.
- The test going forward will be execution with meaningful earnings growth needed to justify the recent share price rally.
|
| Mineral Resources Ltd |
+11.5% |
- Revenue was up 44% and Underlying EBITDA increased 183%, both ahead of consensus.
- FY27 guidance more modest regarding production targets but resuming dividend payments was another welcome positive of the result. Mining services volumes also outperformed consensus with guidance of 11.5% growth notably ahead of the 9.7% growth expectation view.
- Summary: dividend resumption and thoughtful capital management setting up attractive harvesting strategy with a focus on reinvestment for growth as well including ancillary opportunities and, potentially, new verticals such as copper. The company now offers some yield upside with solid recurring revenue from Mining Services, materially reduced leverage and additional growth opportunities in iron ore and lithium as well as offshore potentially.
|
| Origin Energy Group (ORG) |
+8.0% |
- Revenues missed (-2.4%) while earnings as measured by EBITDA beat expectations (+2.6%)
- Energy Markets EBITDA for FY27 at $1.7bn was ahead of consensus ($1.676bn, +1.4% beat)
- Octopus EBITDA forecast to be near breakeven; Origin owns 22.7% of the business worth approximately US$1.96bn (A$2.795bn) as of July 2026, worth almost 14% of Origin’s market value.
- This stake could be a catalyst for shareholder returns on an eventual listing of Octopus subsidiary Kraken technologies with proceeds from a sale available for dividends or a share buyback.
- Guidance for investment spending surprised at $0.55bn vs consensus expectations for $0.71bn, 22.8% less. This frees up capital either for deleveraging or additional shareholder returns in line with the company’s free cashflow policy.
- A capital-light business model going forward but tensions in broader market with lower prices looming as Eraring coal power plant shutdown continues to be deferred adding excessively to supply and making new additions difficult at this juncture. Data centre demand may change this dynamic eventually, but current market conditions appear subdued, limiting growth in the near term though income generation remains attraction.
|
| CAR Group Ltd (CAR) |
+6.4% |
- The company beat expectations for adjusted NPAT (+0.4%) but saw slight misses on EBITDA (-0.3%) and Revenue (-1.2%)
- Growth forecasts for FY27 were the highlight:
- Revenue +12.5% (consensus +9.8%)
- EBITDA +11.5% (consensus: +10.7%)
- Management anticipates margin compression with investment in US Margin and Asia Dealer Direct/Home Services products to see revenue growth outpacing profits in the short term.
- Overall, a good result with leadership highlighting positive AI developments in generating efficiencies within the broader business.
- August performance also benefitted from a short squeeze where short sellers anticipate weaker results and have to buy back aggressively to cover the short and limit their losses if proven incorrect.
- Summary: A good result with strong outlook the highlight though we note competition concern in some key markets where additional reinvestment has been required. Result also showed negligible signs of disruption contrary to the AI anti-classifieds narrative that has pervaded markets to start the year.
|
Notable lowlights
| Company |
August Performance |
Key points |
| Commonwealth Bank of Australia (CBA) |
-9.9% |
- Commonwealth Bank of Australia (CBA) continued its recent run of beating expectations with a cash profit of $10.982bn in FY26, an increase of 7% on FY25 and 1.2% ahead of market expectations for $10.852bn.
- The company raised its dividend to a total FY26 payout of $5.05 fully franked, an increase of 4% on FY25.
- Looking ahead, inbound mortgage applications have softened markedly since the Federal Budget announcements on 12 May with CBA seeing a 15% decline over this period echoing Westpac’s 20% decline over this period. This poses a likely headwind to revenue growth across the sector.
- While CBA continues to be a sector leader, it is not immune to a housing market slowdown. It also trades at a lofty valuation versus global peers for relatively lacklustre growth.
- FY27 is a point of concern with decelerating credit growth and rising competition to weigh on growth and profitability. These pressures could place CBA’s premium valuation under further strain.
|
| Mader Group Ltd (MAD) |
-10.6% |
- FY26 revenue up 15% and EPS up 14%. Currency a notable headwind with US growing sales 17% on constant-FX basis but “only” 12% when translated into AUD. Net cash position at $35.7m a marked improvement on $8.3m net debt position in FY25.
- Outlook: FY27 revenue of at least $1.13bn (+13%) and NPAT of at least $72.5m (+11%) with investment a drag on near term profitability as the business targets growth initiatives for 15% p.a. of medium to long-term EPS growth.
- Profit guidance the bigger drag on share price with $72.5m vs $77.8m expected. Most of the miss was due to growth investment, however, which should support the longer-term thesis.
- Summary: Disappointing to see guidance below expectations but overall thesis for mid-double-digit growth over time at relatively undemanding valuation (~16.8x) appears intact. If growth opportunities remain attractive that’s the best long-term approach in our view with management targeting a slew of attractive verticals including defence and infrastructure maintenance.
|
| Wesfarmers Ltd (WES) |
-11.1% |
- Wesfarmers beat expectations for both sales (+0.1%) and EPS (+1.4%) with FY26 sales up 3.7% and underlying UPS rising 8.3%.
- Bunnings continued to excel even with interest rate headwinds with acceleration to start FY27 that is expected to unwind somewhat given a boost from a warmer-than-usual July. FY26 revenues rose 4.1% and underlying profit 5.1%
- Kmart emerged as a key point of weakness with FX headwinds (-1%) dragging on store growth in second half of FY26 seeing profit growth of 6% on muted sales (up 2.8%). The start to FY27 was also below investor expectations, fuelling concerns about consumer spending after JB Hi-Fi’s earlier disappointment.
- New categories including marketplace and advertising (Bunnings’ Hammer Media) offer avenues for further growth potential
- Summary: A reasonable result give rate hikes and housing headwinds. Stock is not cheap per se at 26.7x FY27 EPS but offers attractive 4.7% yield (fully franked) and underlying 7% p.a. EPS growth (FY26-FY29) coupled with a resilient overall business.
|
| JB Hi-Fi Ltd (JBH) |
-18.3% |
- JB Hi-Fi delivered a largely in-line result for FY26 with revenue of $11.1bn (up 4.8%) and earnings per share of $4.481 (up 2.9% on underlying basis) versus consensus expectations for $11.125bn and $4.485 respectively.
- Management upped the dividend payout ratio from 65% of NPAT to a broader (and higher) range of 70-80% with the total FY26 dividend rising to $3.37 per share, up 22.5% on FY25.
- The bigger concern was the start of FY27 trading. For the month of July, the company saw broad weakness with total and comparable sales growth in negative territory for every division bar New Zealand. This contrasts to consensus expectations for 4.1% in total revenue growth in FY27. A strong bounce for the rest of FY27 was needed just to meet market expectations. A share price correction resulted as expectations were revised lower with revenue expected to now grow only 1.7% (i.e. below inflation).
- Comments concerning variability in trading as well as stock availability challenges all suggest a trickier trading environment. While a reasonable result for FY26, the weaker outlook drove a material price correction as near-term headwinds are expected to weigh on the business.
|
Conclusion
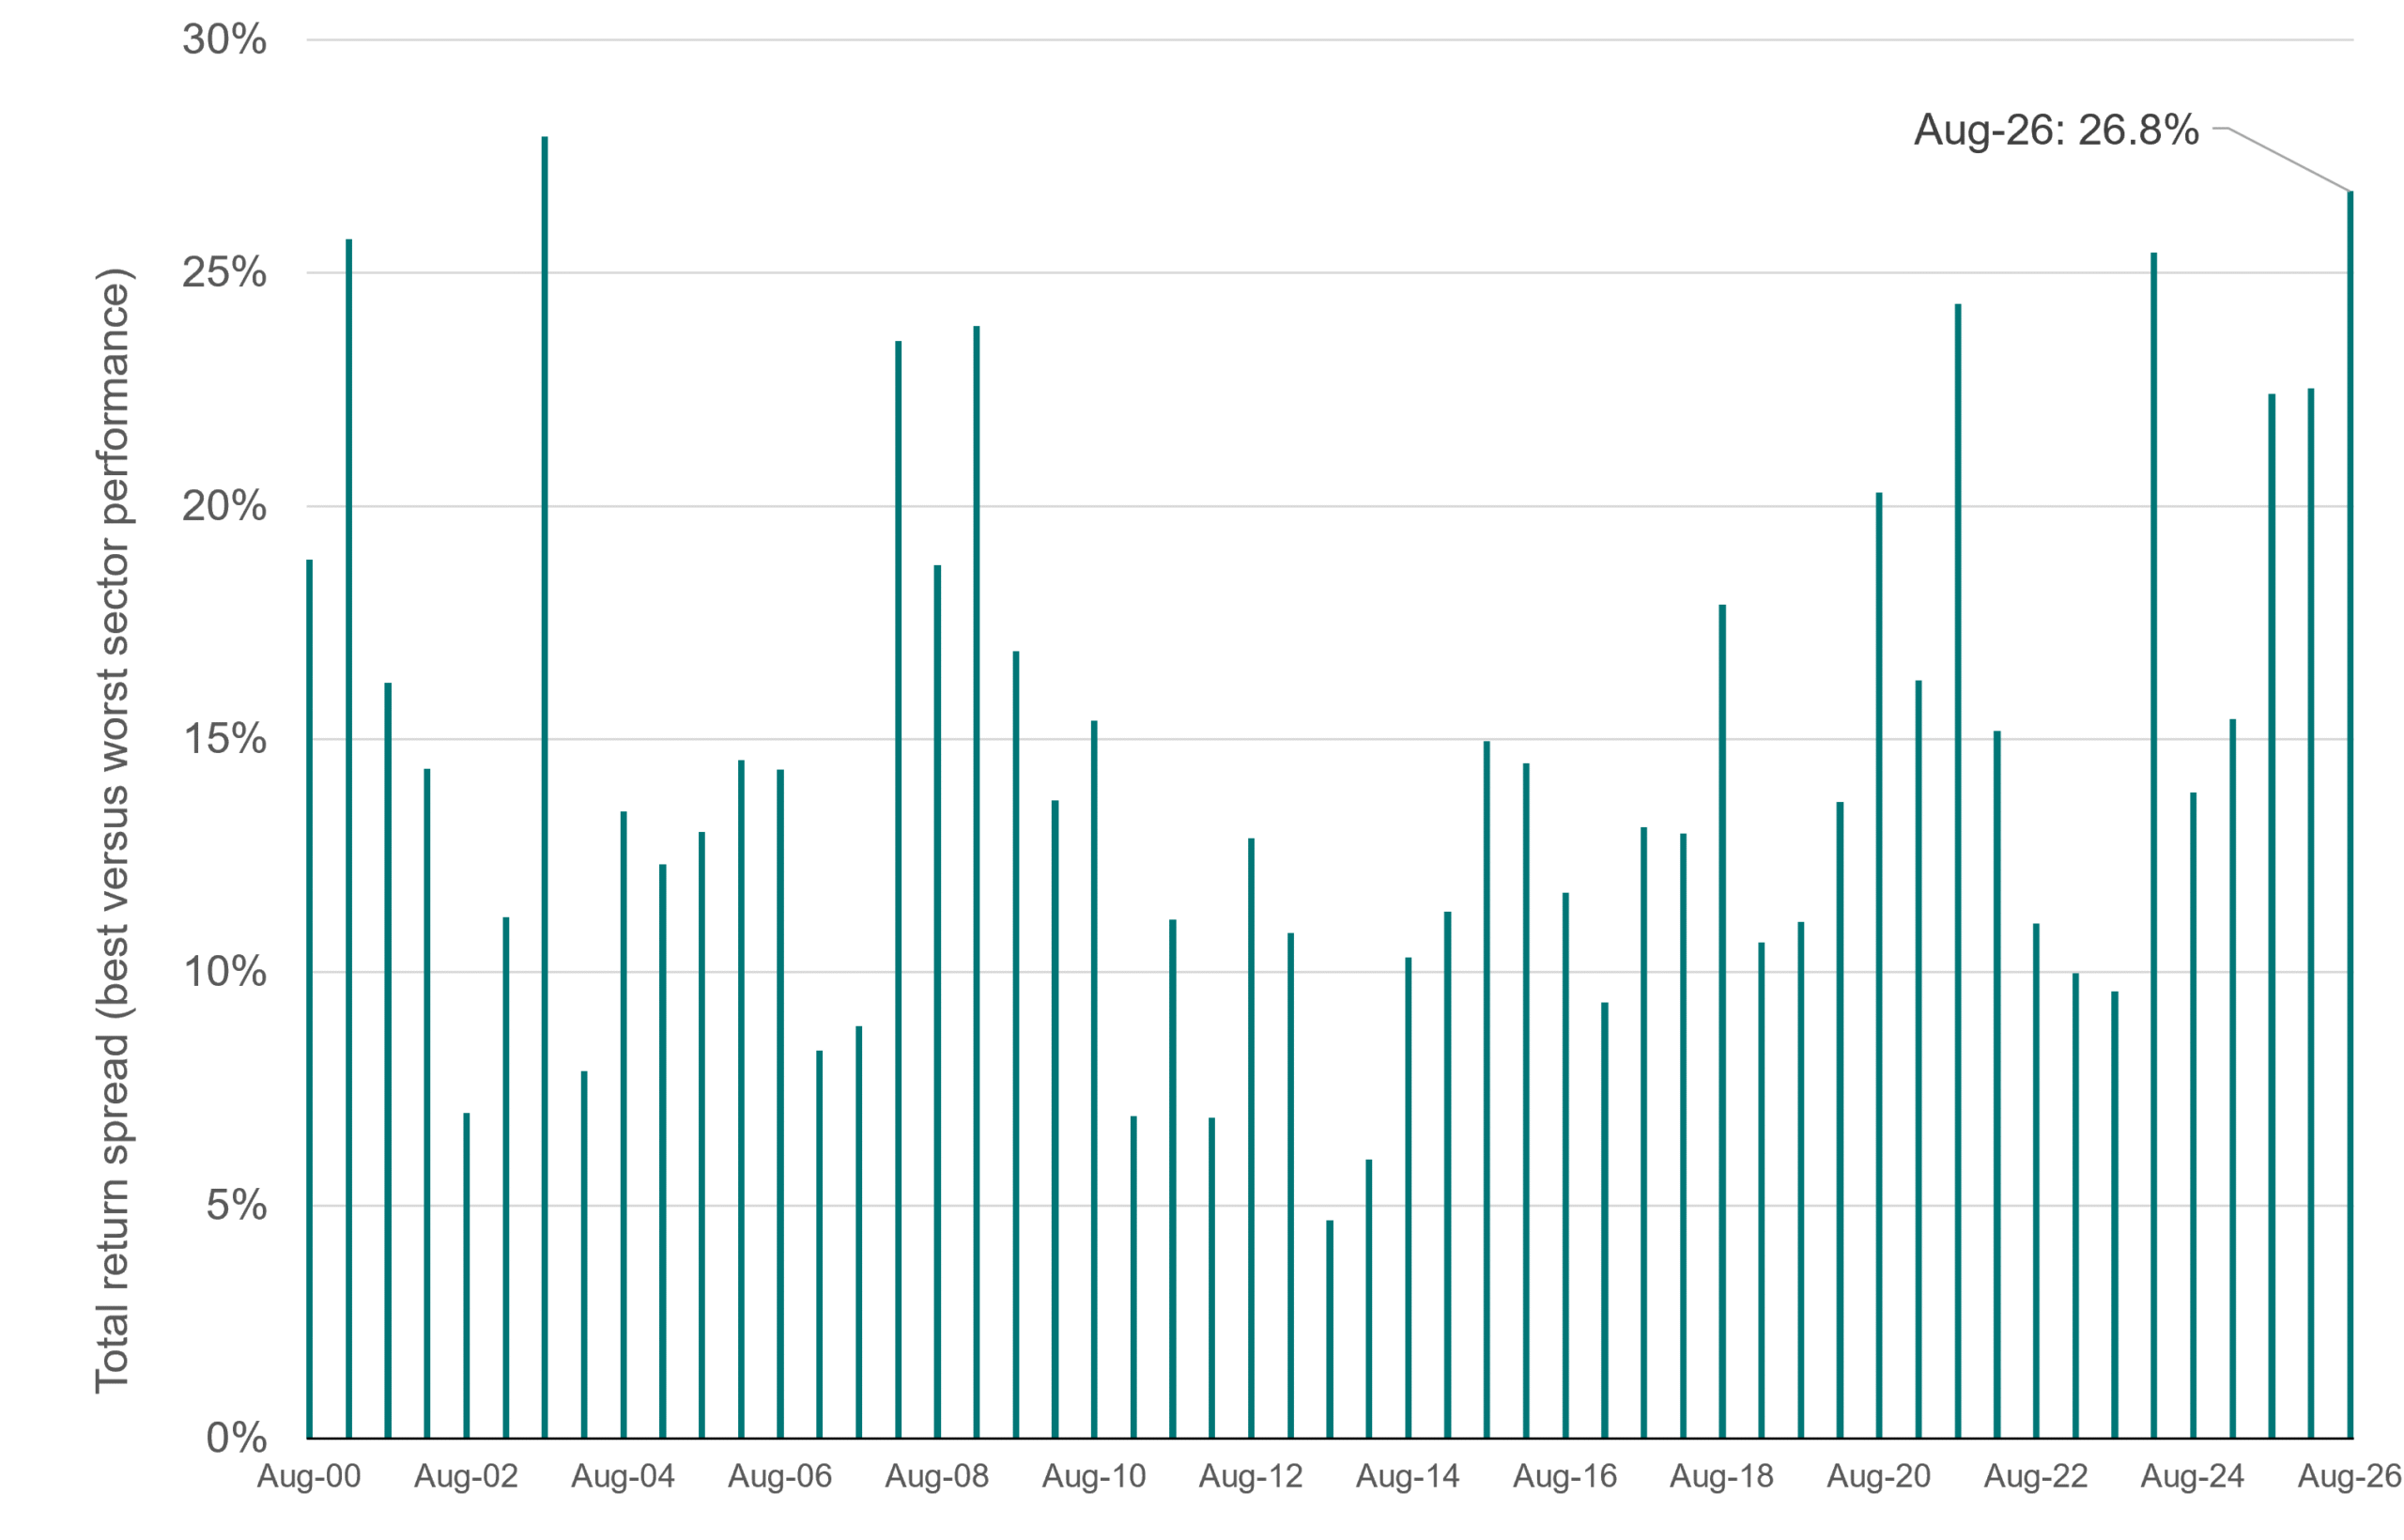
August 2026 was another reporting period where modest market performance (up 1.5%) belied substantial dispersion. The total return spread between the strongest sector (Health Care +18.8%) and the weakest (Consumer Discretionary -7.9%) was 26.8%, its highest level since August 2003, a result marked by a post Dot Com bubble bursting and subsequent recovery for our Technology sector.
ASX sector total return dispersion during reporting season (Aug-06 to Aug-26)
Source: Bloomberg, PPSPW calculations
Macroeconomic conditions have played a role in seeing valuations become more stretched. The Australian market trades at 18.1x FY27 expected earnings, a notable 12.2% premium to its 20-year average with earnings growth outside the materials sector looking challenged. Income expectations are also subdued with a forward dividend yield of 3.6% (pre-franking), well below historical averages in the mid-4s. This comes against a challenging backdrop for generating sales growth most notably in the Financials sector as a housing market slowdown weighs on credit growth. Overall, we would need to see an improvement in economic fortunes, most likely in the global economy, to support an improvement in earnings growth with the domestic economy remaining mired in a spell of weak productivity at the lower end of developed market peers. Alternatively recent share price weakness would need to persist further to see valuations normalise with Australian banks in particular trading at lofty levels relative to modest expectations and even more stark when compared against global peers.
This view is general advice only and does not take into account your personal circumstances or finances. If you have further questions, we encourage you to consult with your advisor.