
Australian economy – October 2026
The information in these articles is current as of 1 October 2026.
Part 1: Overview
Australia’s economic outlook is set to deteriorate. While growth has generally outperformed that of many developed economies, inflationary pressures have proven more persistent than expected, reflecting structural capacity constraints and elevated energy prices. The government’s tax reforms have further complicated the outlook, contributing to a significant slowdown in the housing market that is beginning to appear in broader economic indicators and poses a potential risk to overall economic activity.
Growth
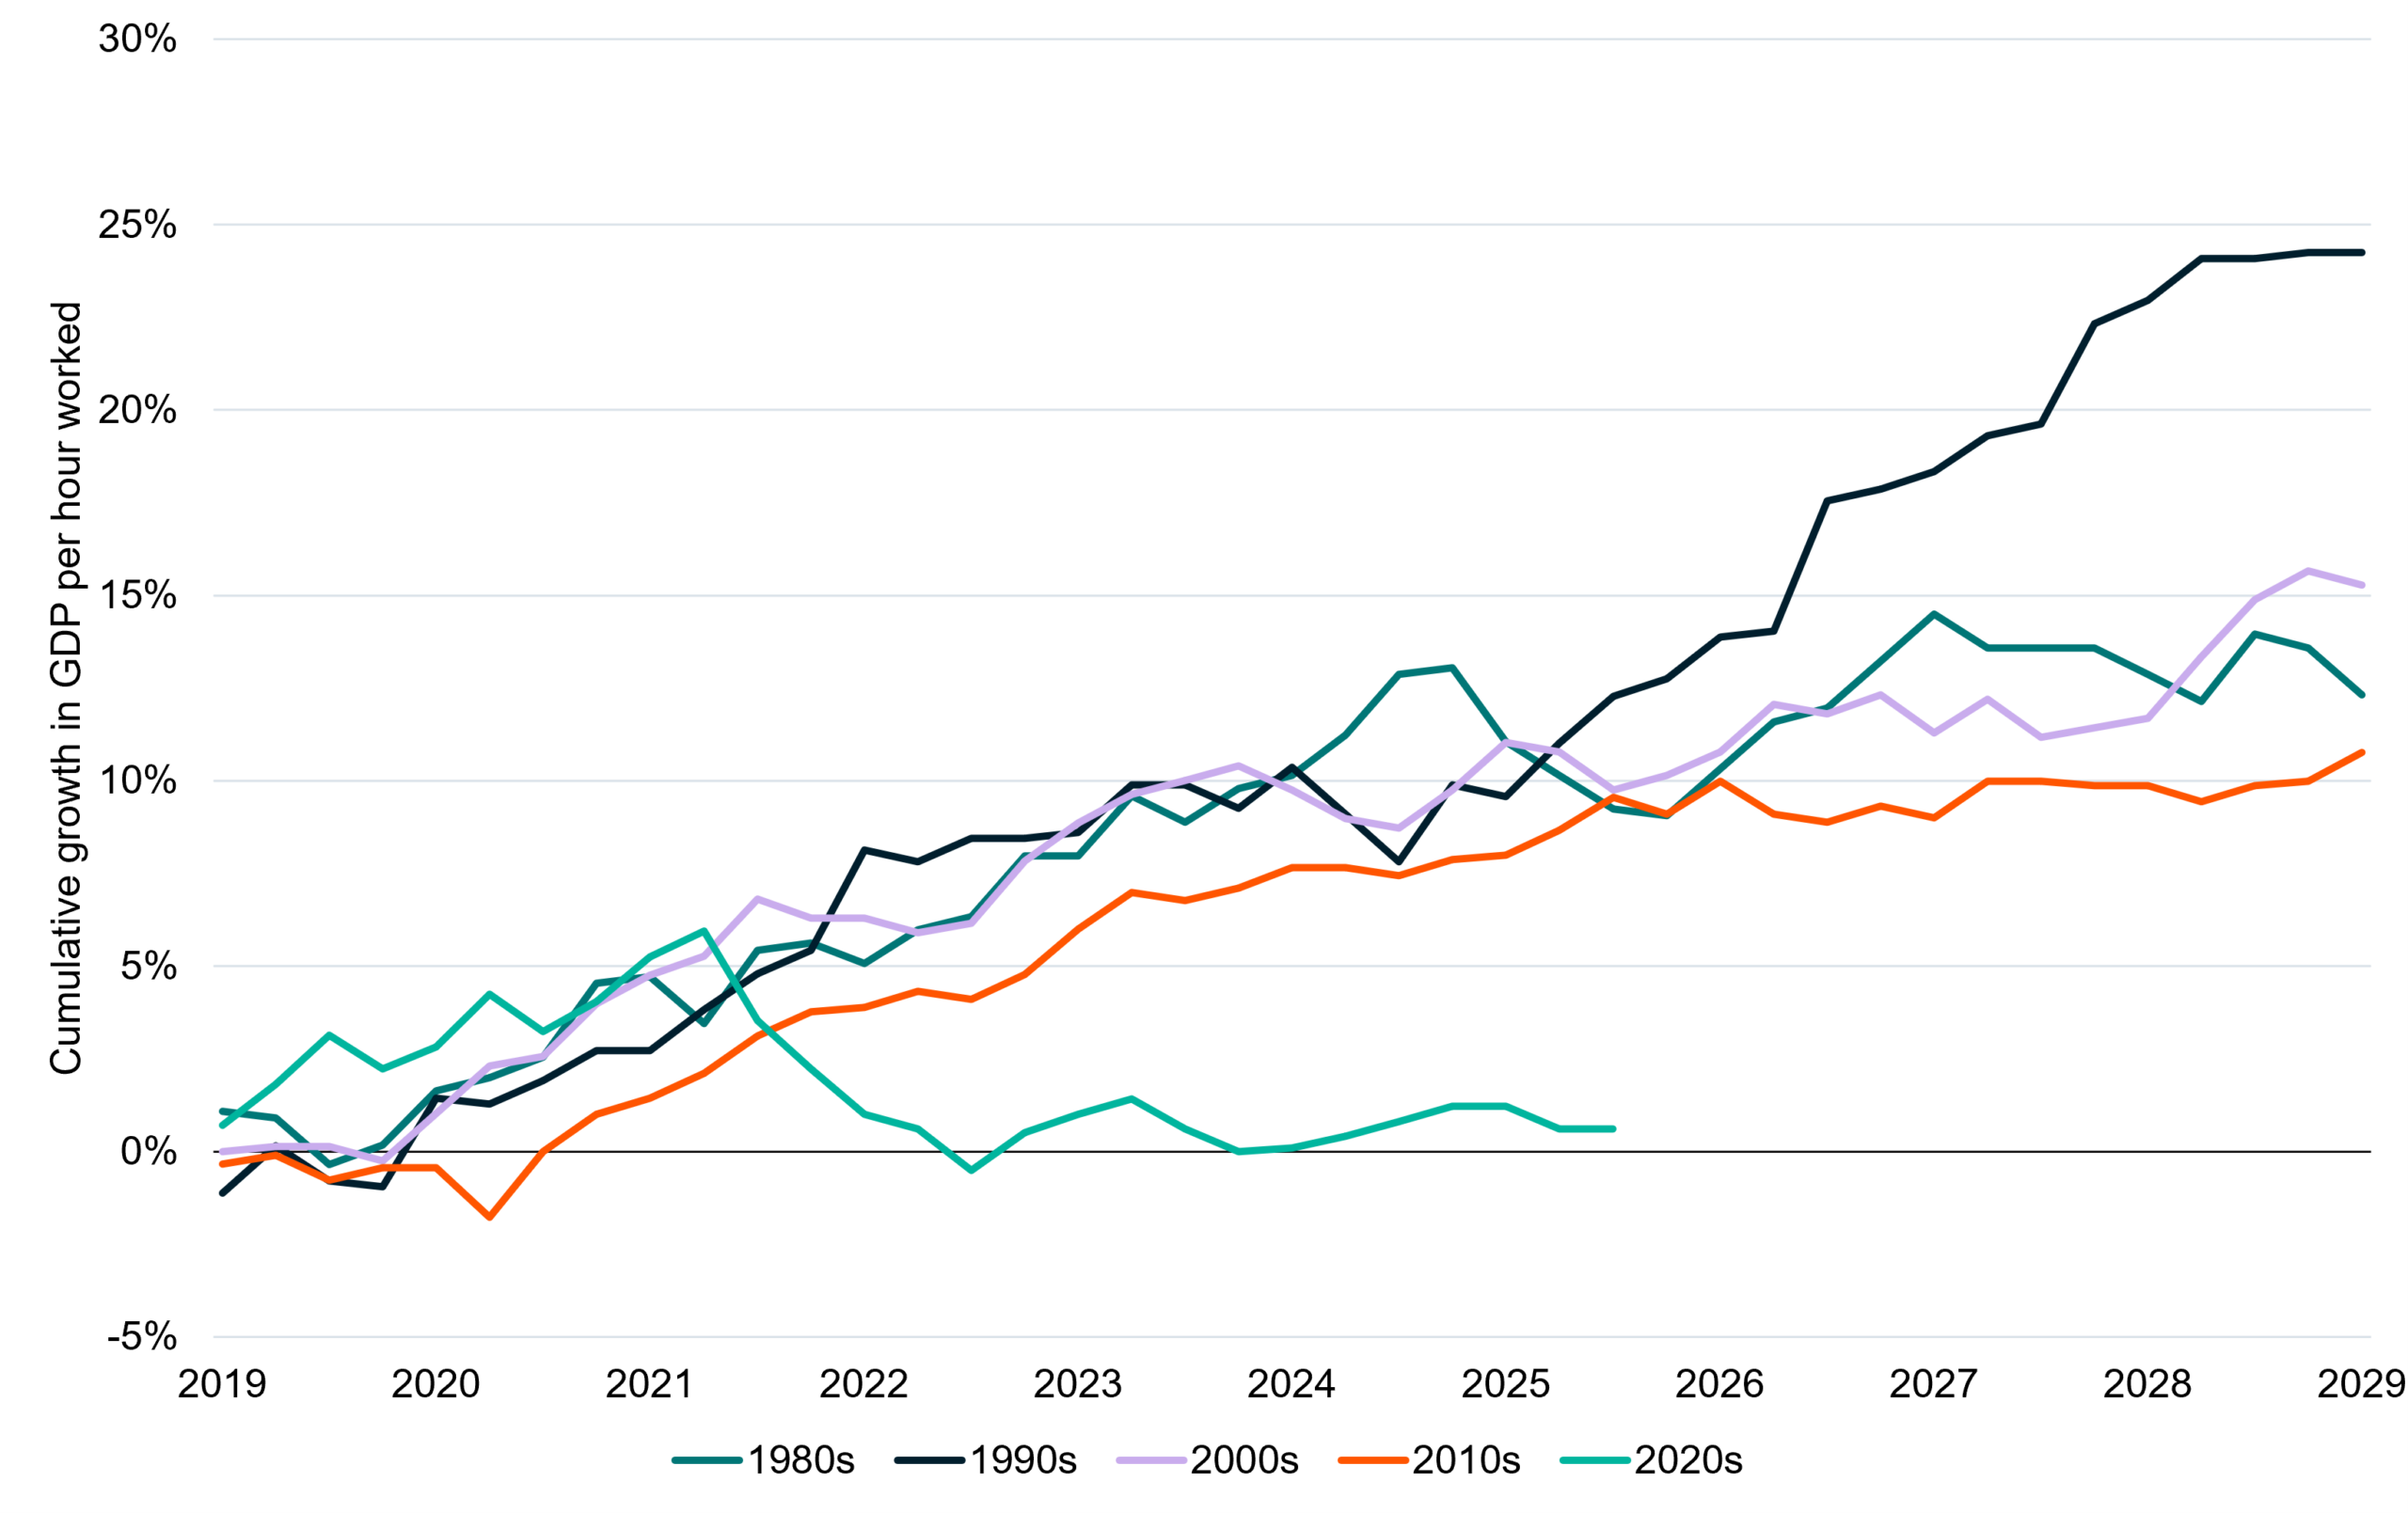
The Australian economy grew 2.1% for the year to June, ahead of consensus expectations with key drivers in household spending (1.2% contribution) and public sector demand (0.8% contribution). A concerning feature has been a marked weakness in productivity over recent years. A crude proxy for productivity is GDP per hour worked and since the pandemic this has languished to levels well below prior decades.
GDP per hour worked – cumulative growth by decade (1980s to 2020s)
Source: ABS, PPSPW calculations
The worry is that without a meaningful improvement in productivity, the economy may struggle to achieve sustained expansion without either ongoing reliance on migration to drive population growth or a willingness to tolerate higher inflation. Productivity has not been a major focus of policymakers in recent years, and the consequences are increasingly evident. Rather than prioritising reforms that lift output and efficiency, policymakers have overseen rapid growth in the care economy, including aged care and the NDIS. While these sectors serve an important social purpose, directing an increasing share of limited resources towards non-market services can constrain productivity growth elsewhere in the economy and contribute to more persistent inflationary pressures.
Looking ahead, the absence of meaningful reform to reduce regulatory burdens or incentivise business investment suggests Australia’s productivity malaise is likely to persist. In such an environment, the economy may remain vulnerable to inflationary pressures stemming from capacity constraints and weak productivity growth, leaving the Reserve Bank with the unenviable task of containing inflation through higher interest rates.
Nevertheless, migration is likely to remain an important backstop, with Australia’s population increasing by 1.4% over the year to June, driven largely by strong net overseas migration. The Government has announced measures aimed at reducing net migration to 225,000 people by FY28, compared with an estimated 292,100 people in the year to March 2026. Such reductions could represent a medium-term headwind for economic growth by slowing population-driven demand across the economy. That said, successive governments have historically struggled to achieve their stated migration targets, particularly in periods of labour shortages and strong demand for skilled workers. As a result, we remain sceptical that the proposed reductions will be fully realised.
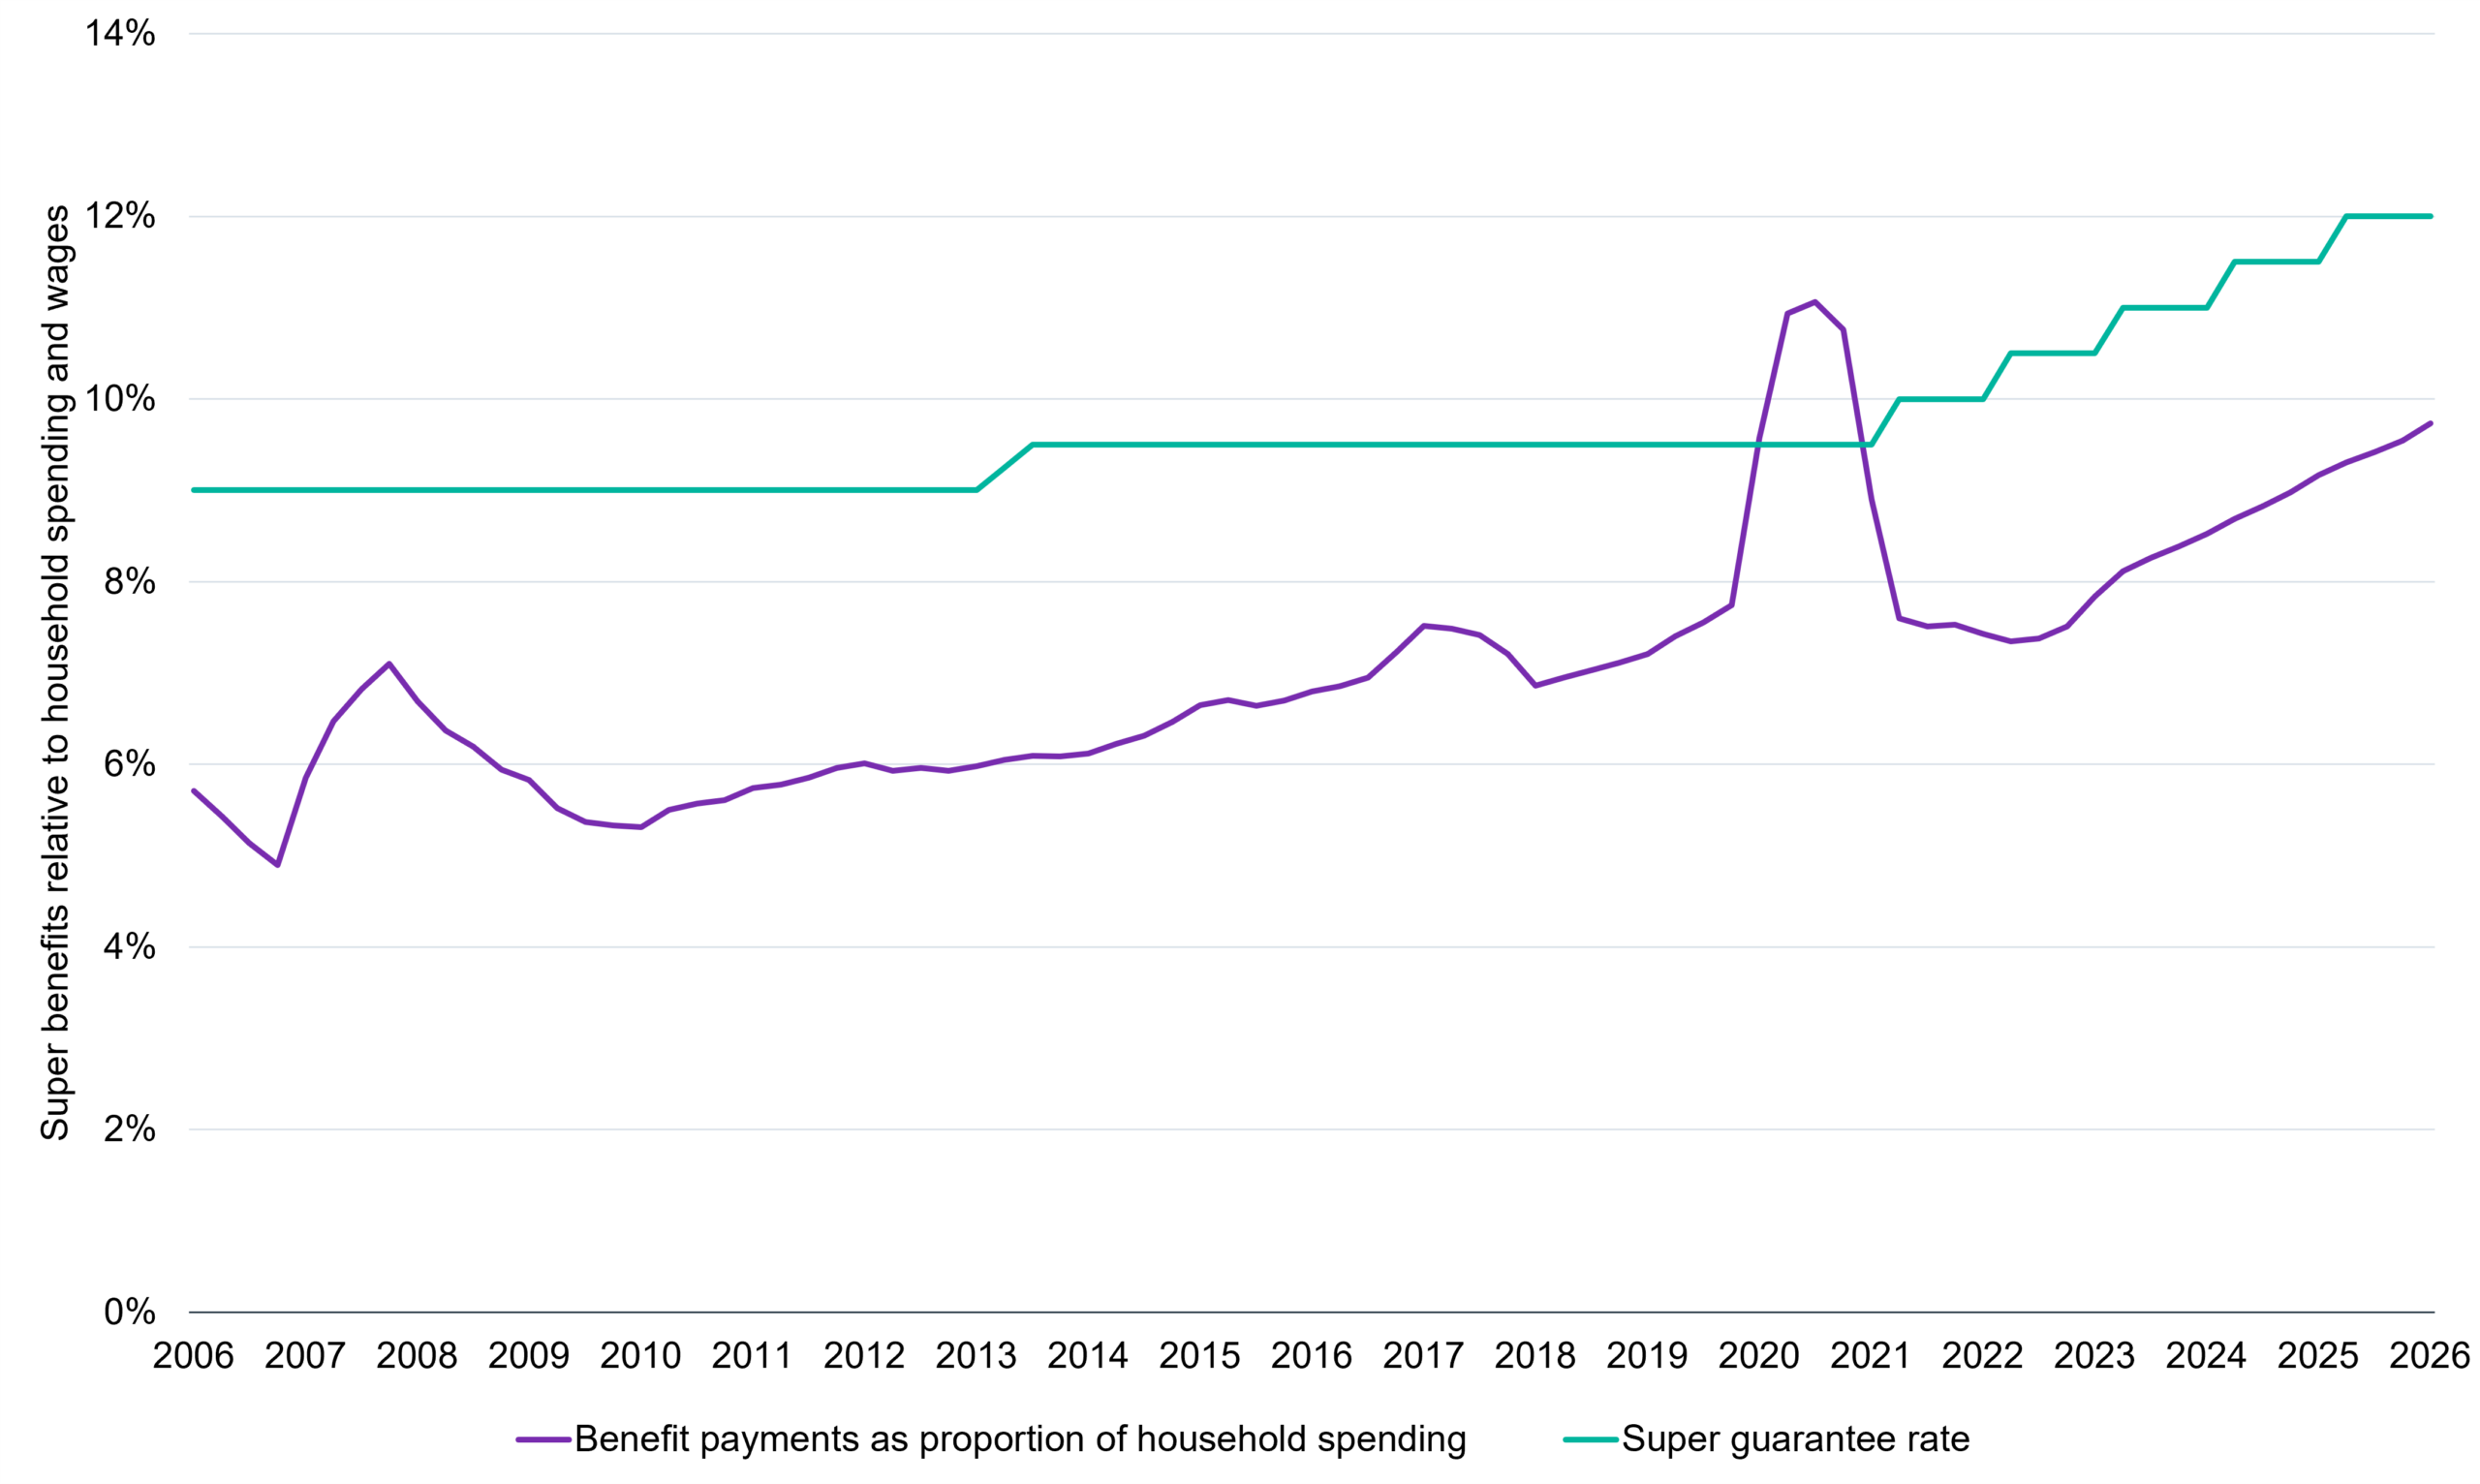
Cash injections from the superannuation system are providing an increasingly important support for economic growth. As more Australians reach retirement age, superannuation benefit payments continue to rise and have become a significant contributor to household cash flows. Benefit payments totalled $148 billion in the year to June, equivalent to almost 10% of household consumption over the same period. This compares with $65 billion in the year to June 2016, representing growth of almost 9% per annum over the past decade.
While not all of these payments are spent, a meaningful share flows into the broader economy through consumption. As a result, rising superannuation withdrawals should continue to act as an important ballast for growth by boosting aggregate household incomes and spending capacity.
Superannuation benefit payments relative to household spending (Jun-06 to Jun-26)
Source: ABS, APRA, PPSPW calculations
The capital spending boom for AI continues to evolve domestically. This saga is financed largely by offshore capital and should prove relatively insensitive to domestic interest rate conditions. This gives scope for further expansion and support to the broader economy. There will be leakage in the form of higher imports, but the net impact remains positive. The housing market slowdown is one final consideration where prices nationally have slipped 2.7% from their March peak[1]. RBA estimates suggest that a 10% decline in house prices could see a growth headwind of around 0.8% after 6 months and up to 1.6% over the medium term[2].
On the whole, growth should continue to prove resilient though stymied by higher inflation and the interest rates deemed necessary to control these pressures. While the housing market situation poses a concern, we believe the structural supports highlighted should more than offset and see continued expansion.
Inflation
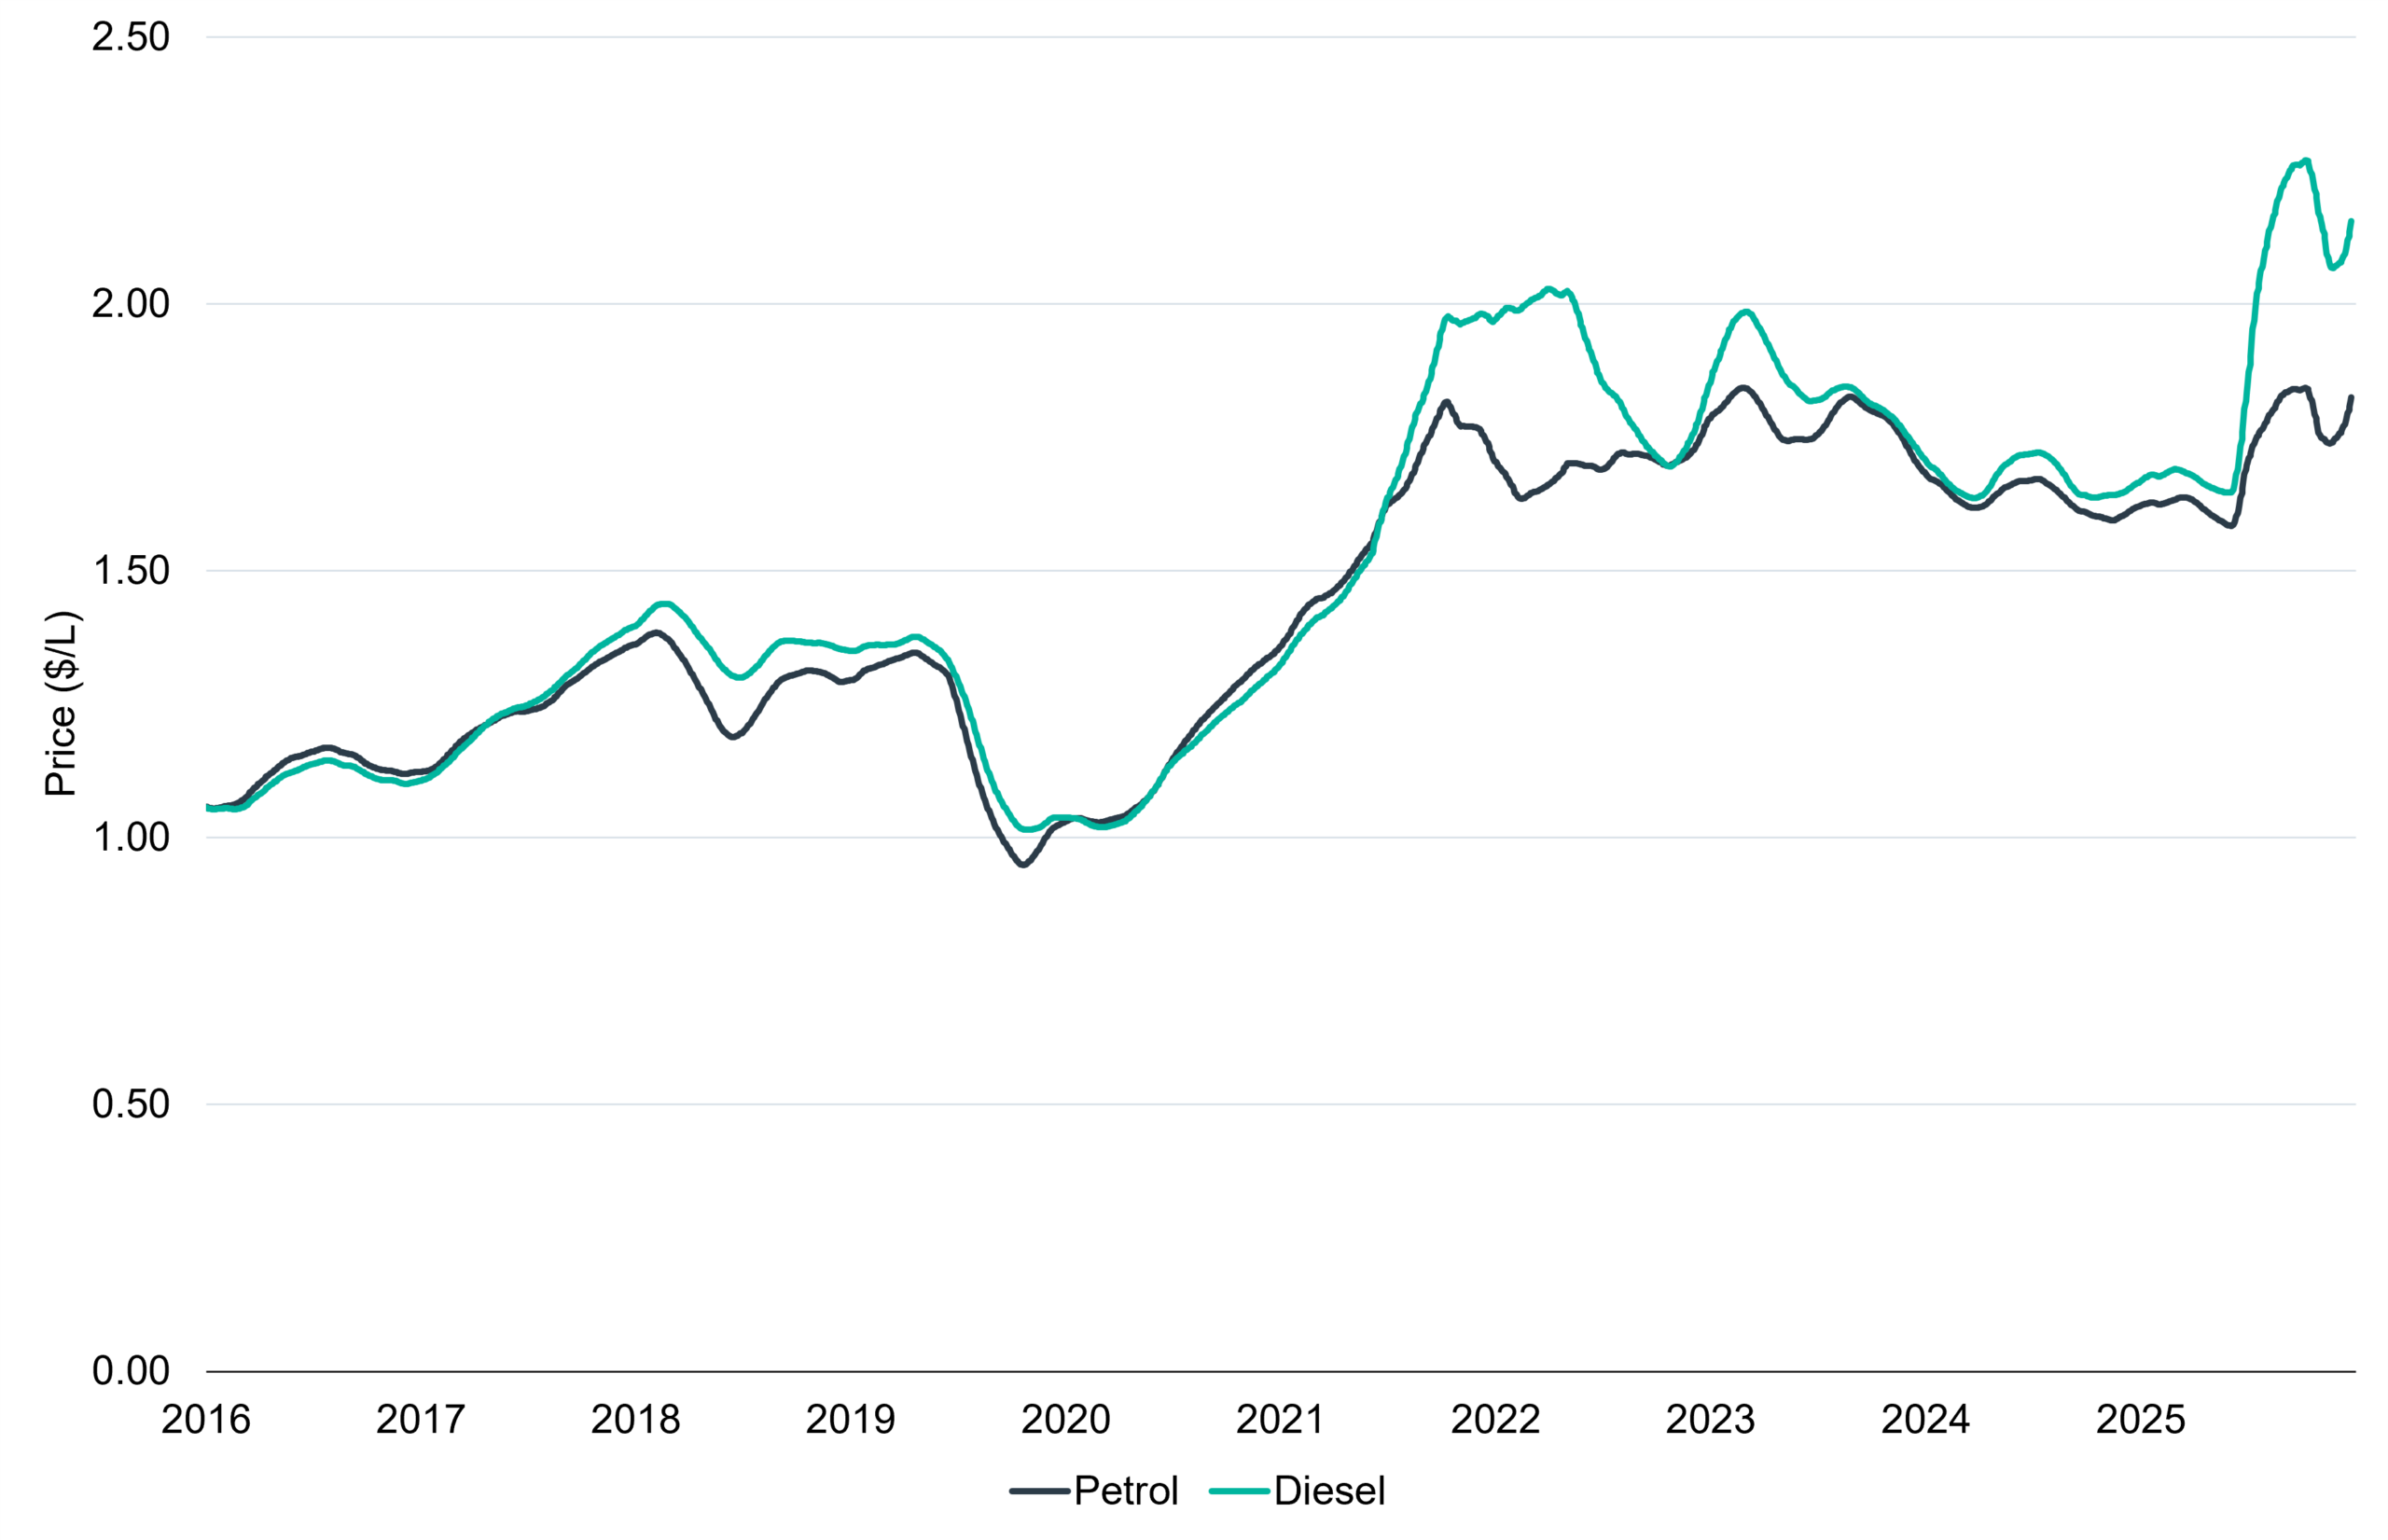
The inflation backdrop remains problematic. After earlier volatility with the cut and subsequent re-introduction of fuel excise duties, we have seen fuel costs settle uncomfortably higher. This follows the ebb and flow of Middle East tensions and will exert a meaningful economic-wide cost. It comes as underlying inflation sits at 3.6% for the year to August stubbornly above the RBA target band of 2-3%.
Petrol versus diesel prices – 90-day average (Sep-16 to Sep-26)
Source: Australian Institute of Petroleum[3]
We expect the higher inflation environment to persist in the near term. The economy remains challenged by low productivity with public sector spending reinforcing a backdrop of excessive demand chasing limited supply. The data centre boom exacerbates this trend with construction feeding demand that will not be halted by higher financing costs. While we acknowledge the possibility that a slowing housing market will provide a deflationary impulse the early signs are not yet evident.
Labour market
The labour market has loosened from extremely tight levels in late 2022 with unemployment now sitting at 4.6% in August. In addition, half of the jobs created since August 2023 have been part-time, a further sign of weaker bargaining power for workers.
Countervailing evidence can be found in the still low levels of underemployment with an underemployment rate of 6.2% well below the high-8% average we saw in the pre-pandemic environment. This still suggests relatively tight demand conditions with vacancy growth in construction and public sector roles adding to demand. In addition, the uptick in the unemployment rate to 4.6% was driven by a shifting participation rate which can be sensitive to monthly volatility. It remains to be seen whether recent loosening is a trend or statistical sampling variation.
While there are signs of greater labour market slack the overall impression is not alarming. Demand in the form of job vacancies has proven resilient and we do not think current conditions are severe enough to warrant halting the RBA’s hiking ambitions.
Reserve Bank of Australia (RBA)
The RBA hiked its target cash rate by 0.25% to 4.6% on 29 September. Key to its thinking has been the ongoing concern over weak productivity driving stronger inflationary pressures. The recent impost of higher energy prices proved telling as the RBA followed hikes by other central banks to contain inflationary expectations. Current market pricing implies at least one more hike to interest rates by early next year[4]. We do not see sufficient countervailing forces to form a different opinion. Energy-driven inflation remains a reality of the current economic landscape. A disinflationary impulse from the housing market could emerge but is yet to do so. Accordingly, we believe the likeliest scenario is one more rate hike by year-end or early 2027 before the RBA holds watching for signs of easing inflationary pressures.
Conclusion
The underlying drivers of Australian growth remain intact particularly migration and public sector spending. An investment boom in AI-related infrastructure is now another pillar for growth. These culminate in enviable expansion relative to other developed peers but at the cost of entrenched inflation. We will likely see the RBA act again to hike in the months ahead until near-term growth headwinds such as the weakening housing market can generate a sufficiently powerful impulse to contain inflationary pressures.
Part 2: Key economic indicators
| Economic snapshot | Last reported result | Date |
| Growth (GDP) | 2.1% | Jun-26 |
| Inflation | 3.5% | Jul-26 |
| Interest rates | 4.6% | Sep-26 |
| Unemployment rate | 4.5% | Aug-26 |
| Composite PMI | 50.8 | Sep-26 |
| Economic snapshot | 2026e | 2027e |
| Growth (GDP) | 1.9% | 1.7% |
| Inflation | 3.9% | 2.8% |
| Interest rates | 4.6% | 4.3% |
| Unemployment rate | 4.4% | 4.7% |
| US Dollars per 1 Australian Dollar ($) | 0.72 | 0.73 |
Source: Bloomberg.
[1] E. Creagh, ‘realestate.com.au Home Price Report – August 2026’, realestate.com.au (1 September 2026), realestate.com.au Home Price Report – August 2026 – realestate.com.au, (accessed 2 September 2026).
[2] S. Oliver, ‘The Australian home price downturn deepened in August, with more to go’, AMP (1 September 2026), Oliver’s insights – Australian home price downturn – AMP, (accessed 2 September 2026).
[3] ‘Historical ULP and Diesel TGP’, Australian Institute of Petroleum (25 September 2026), Historical ULP and Diesel TGP Data | Australian Institute of Petroleum, (accessed 27 September 2026).
[4] ‘RBA Rate Tracker’, ASX (29 September 2026), RBA Rate Tracker, (accessed 30 September 2026).