

International equities – July 2026
The information in these articles is current as of 1 July 2026.
Overview
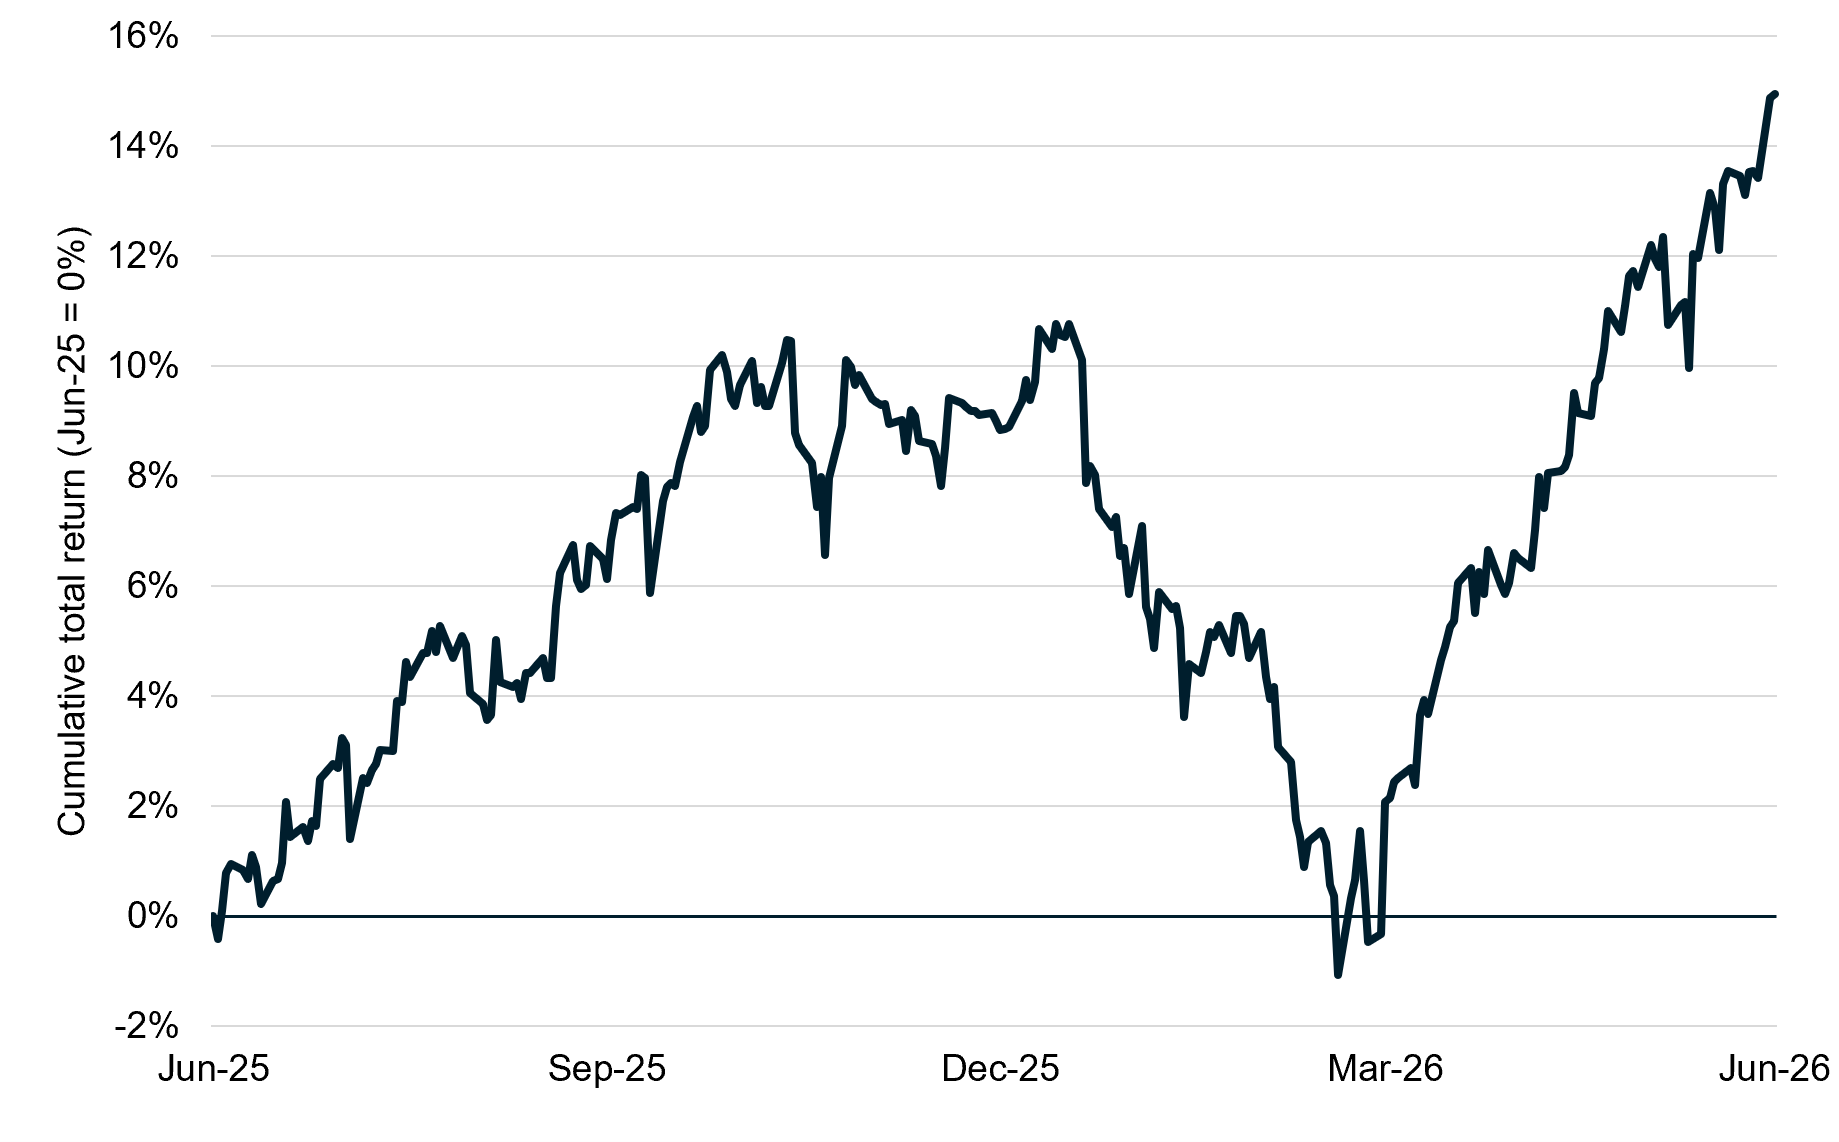
International markets soared back from a tough March quarter rising 12.6% for the three months to 30 June and taking their return to 14.9% for the full year. The full-year performance continued to be challenged by a stronger Australian dollar with the hedged benchmark up 22.7% for the year to 30 June, a difference of 7.7%.
MSCI World ex Australia net total return index (Jun-25 to Jun-26)
Source: Bloomberg
Outlook
The April ceasefire between Iran and the US-Israel coalition has seen geopolitical risk fall by the wayside. While this ceasefire has been marked by sporadic bursts of violence, it appears to be holding. The US and Iran are now engaged in further negotiations for a formal peace deal to be reached. The key criterion has been the reopening of the Strait of Hormuz that has alleviated pressure on global energy markets.
Artificial Intelligence (AI) remains the defining investment debate in global markets. A central question for investors is where the economic value created by the current AI investment cycle will ultimately accrue. During 2026, market consensus has shifted away from the hyperscalers – Microsoft, Amazon, Meta and Alphabet – which are funding much of the AI infrastructure build-out, towards the companies supplying the critical hardware that enables it. This has benefited semiconductor manufacturing leader, TSMC, and lithography specialist ASML, both of which occupy highly strategic positions within the AI supply chain. More recently, memory chip producers have emerged as key beneficiaries as advanced memory has become a critical bottleneck for AI model development and deployment. As a result, Micron, Samsung and SK Hynix have gained significant pricing power, enabling them to capture an increasing share of the value generated by the rapid growth in AI-related capital expenditure.
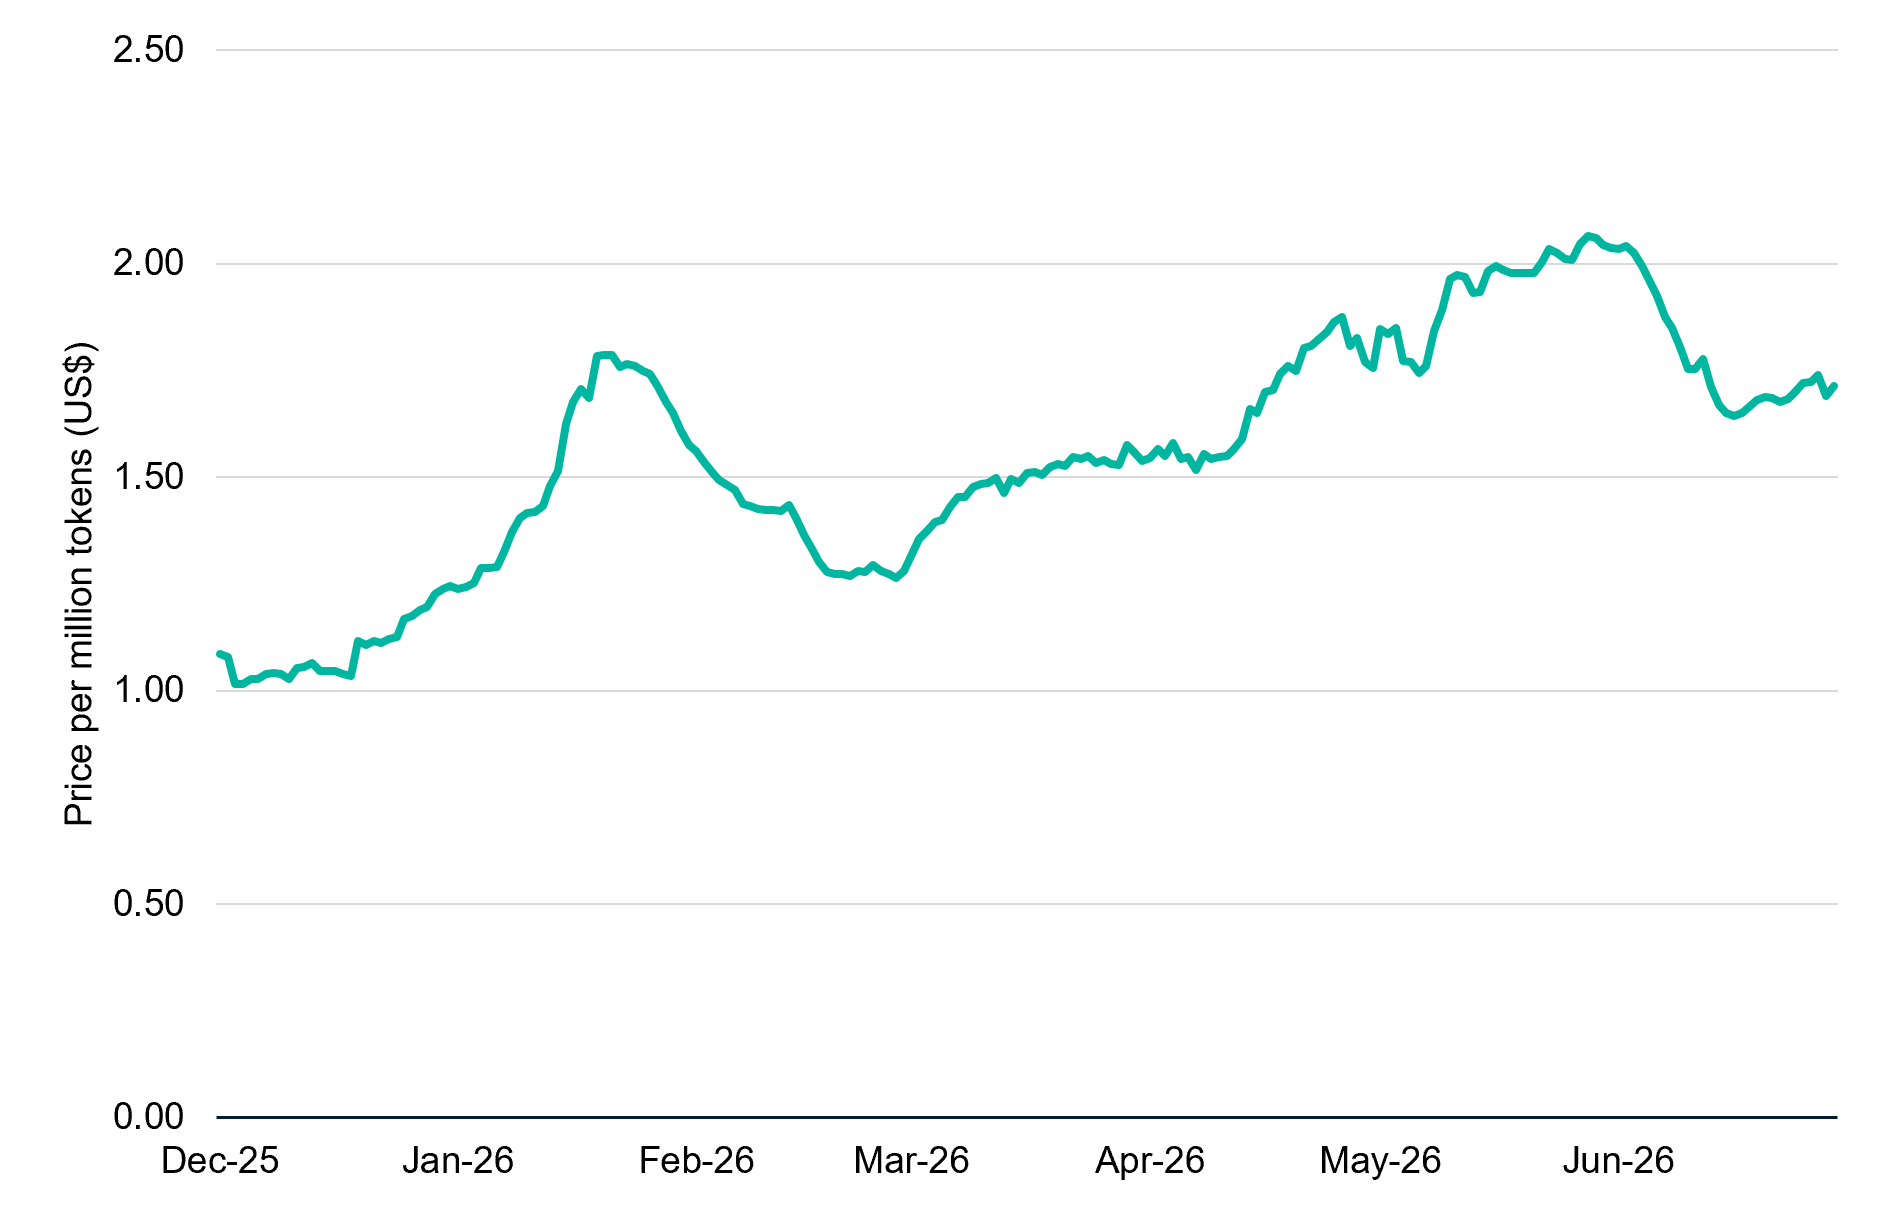
Since the start of 2026, AI model developers have been able to set higher prices as new features encourage increased adoption and add support for further reinvestment. That pricing pressure has fallen under scrutiny with AI model cost emerging as a point of concern amongst users, particularly businesses where some have seen budget blowouts and, in aggregate, growing signs of a potential pullback in demand for the cutting-edge options in favour of “good enough” open-source models[1].
Artificial Intelligence model price index (Dec-25 to Jun-26)
Source: Bloomberg.
This growing concern around value-for-money could present a significant challenge for the lofty valuations of AI leaders OpenAI and Anthropic as they approach their anticipated public listings later this year. The implications may be even broader for SpaceX, which has increasingly positioned itself as an AI provider and has already experienced a mixed reception from public market investors. The trend could also intensify scrutiny of the hyperscalers that have been supporting these businesses through substantial capital injections and elevated investment spending.
Ultimately, the key drivers of equity market performance will be whether earnings growth continues to materialise and whether investors are paying a reasonable price for that growth. On the earnings front, there is little doubt that a substantial investment boom remains underway, with an increasing, though still relatively modest, share of spending being financed through debt. Importantly, this investment cycle continues to be supported by strong returns on capital.
Ultimately, the supernormal profits currently being earned off the back of the AI boom cannot be sustained forever. In the short run, however, management commentary across the sector continues to signal support for further capital expenditure. Given the ongoing strength in demand and profitability, we see little evidence at present to suggest a meaningful deviation from the current trend.
Potential headwinds include weakening investor sentiment as these companies become increasingly capital-intensive, as well as potential national security constraints. The recent US decision to block exports of Anthropic’s Mythos model may serve as an early warning sign of a more restrictive regulatory environment. Chinese competition also warrants close attention, with domestic alternatives demonstrating encouraging progress in capability and narrowing the gap with leading Western models, albeit still constrained by US technology export restrictions. While these risks should not be dismissed, they are not part of our base case. We believe earnings momentum remains sufficiently strong to support a constructive near-term outlook.
Table 4: Regional Forward Price-Earnings ratios versus long-term averages as at 30 June 2026
| Region | Forward P/E ratio | 15-year Average Forward P/E ratio | Potential upside/downside |
| USA | 18.8x | 16.9x | -10.1% |
| All Country World (ex-US) | 13.1x | 12.9x | -1.5% |
| Australia | 16.4x | 15.2x | -7.1% |
| Europe | 14.4x | 13.4x | -7.0% |
| Emerging markets | 10.2x | 11.1x | +8.6% |
| Japan | 16.4x | 14.1x | -14.1% |
| UK | 12.3x | 12.3x | -0.2% |
| China | 9.4x | 10.4x | +10.8% |
Source: Bloomberg
When considering market and regional valuations, they are not, in aggregate, overly concerning. Emerging Markets appear relatively inexpensive in contrast to Japan and the US, but this ignores future earnings growth potential beyond 2027.
Recommendation: Retain overweight.
Market optimism appears well founded in the near term. While pockets of valuation exuberance are emerging, we do not believe they present a material headwind to equity markets at this stage. The easing of geopolitical tensions surrounding Iran is supportive of global growth, and there are currently no signs that investment in AI infrastructure and capabilities is slowing. As a result, global equities remain underpinned by strong earnings growth expectations, which continue to be reinforced by the ongoing AI investment cycle and attractive returns on capital. On balance, we believe the risks remain skewed to the upside and continue to advocate maintaining an overweight allocation to equities.
[1] P. Smith, ‘AI bill shock: Corporates revolt against costly models’, Australian Financial Review (30 June 2026), AI pricing bites for companies who encouraged employees to use it, (accessed 30 June 2026).