Australian economy – July 2026
The information in these articles is current as of 1 July 2026.
Part 1: Overview
The outlook for the Australian economy has softened heading into the second half of 2026. The combination of embedded inflationary pressures, higher interest rates and a higher-taxing Federal Budget pose notable growth headwinds in the near term. One offsetting factor will be elevated levels of health and social spending across both a State and Federal level that see fiscal policy as a net boost to growth. Finally, the boom in artificial intelligence-related spending has arrived domestically and looks set to provide a meaningful growth tailwind in the years ahead.
Fiscal policy
The Federal Budget loomed large in the June quarter with key economic changes including:
- Replacing the 50% discount method for capital gains taxation with an indexation approach targeting the taxation of “real” (after-inflation) gains
- Removing negative gearing (using investment losses to offset other taxable income) from existing residential property assets
- NDIS scheme reforms expected to save $37.8bn over the next 4 years[1]
The tax changes noted above are set to take effect from 1 July 2027 with legislation passing Parliament in late June and are, collectively, anticipated to increase tax receipts by $8.1bn over the next five years[2]. These announcements follow a period where fiscal policy (State and Federal) has been notably stimulative for the broader economy. Recent State Budget announcements may add further to this impulse with the Queensland government announcing a $9.3bn cost-of-living package targeting cheap public transport and a range of household grants for schooling, electricity and other support measures[3].
Australian General Government net operating balance (FY25 vs FY26 YTD)
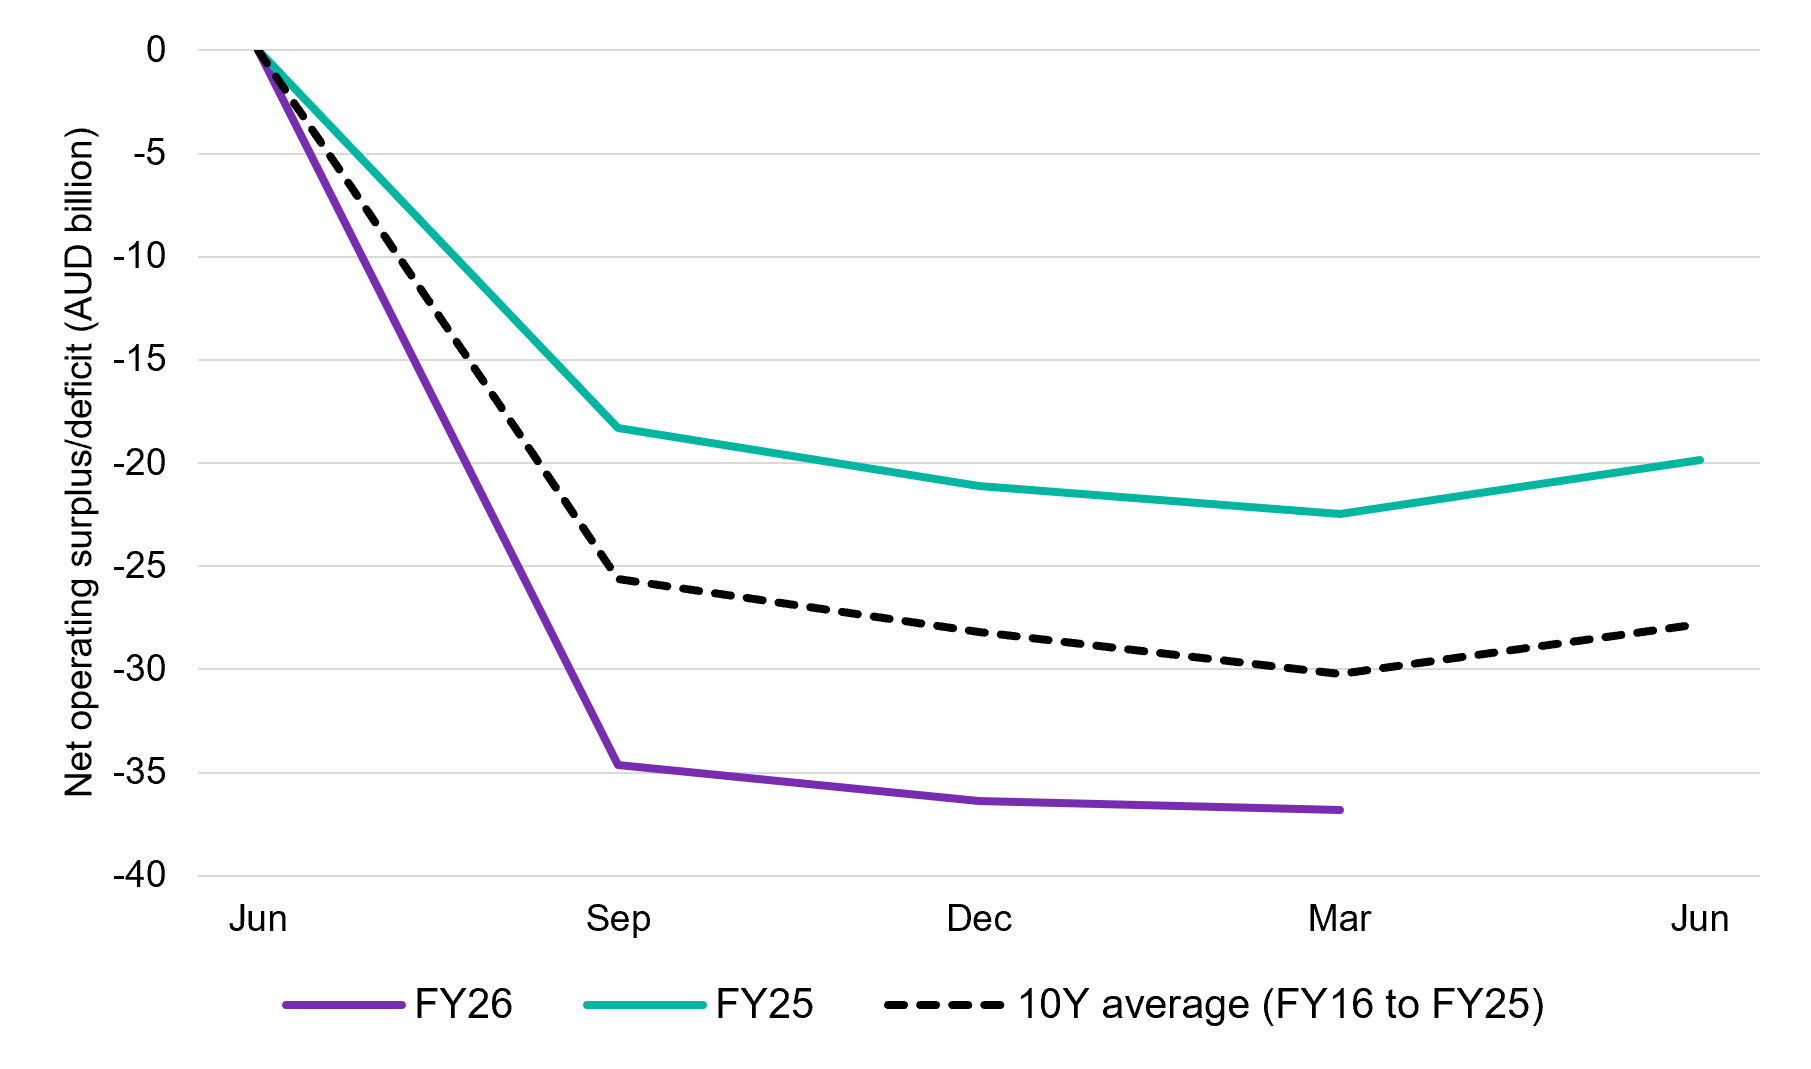
Government spending has been an unequivocal growth tailwind in recent years. The combined impact of these changes appears set to continue being a support particularly at the State level. Federally the policy impact is more nuanced. NDIS cutbacks (if successful) should reduce new spending within the economy. The delays imposed by a political deal with the Greens recently guarantee delayed implementation of these reforms until at least late August[4] and defer their impact further (assuming they go ahead).
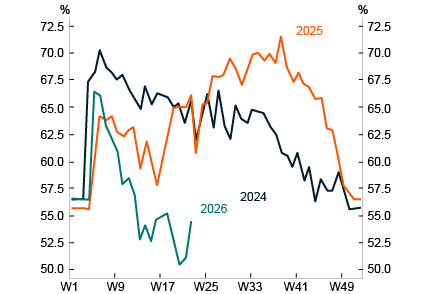
In addition, the planned tax reforms are already souring household sentiment towards property, the leading source of household equity, and could dampen household consumption in the near term. Westpac, for example, have seen housing investor applications drop 20% in the three weeks following the Budget announcement[5] whilst auction clearance rates have slid materially. Initial signs of household behaviour are not encouraging, and we will be closely observing to see if this translates into a meaningful pullback by the sector in the months ahead.
Auction Clearance Rates (weighted average of capital cities)
Inflation
Headline inflation decelerated to 4% for the year to May. A decline in oil prices as well as the impact of halving the fuel excise duty (set to expire from 1 July) drove the shift lower. A growing cause for concern though is the unexpected pick-up in trimmed mean inflation which rose 0.4% for the month and 3.6% for the year to May. This measure strips out more volatile prices including food and energy. Significant contributors to inflationary pressures included new housing construction costs and rents, which both picked up in May. Rents could also see further pressures as investors adjust to weaker after-tax outcomes following the May Budget as well as the still-tight rental market and pressure posed by the RBA rate hikes this year.
An uplift in wage pricing could also bolster inflation. The Fair Work Commission in June announced the uplift in award wages by 6% for the lowest tier and 4.75% for higher-paying award rates[7]. This will take time to work into the broader economy but could exacerbate RBA concerns unless we see businesses absorb part or all of these costs through lower margins or a reduction in headcount.
Australian headline vs underlying inflation (Apr-25 to May-26)
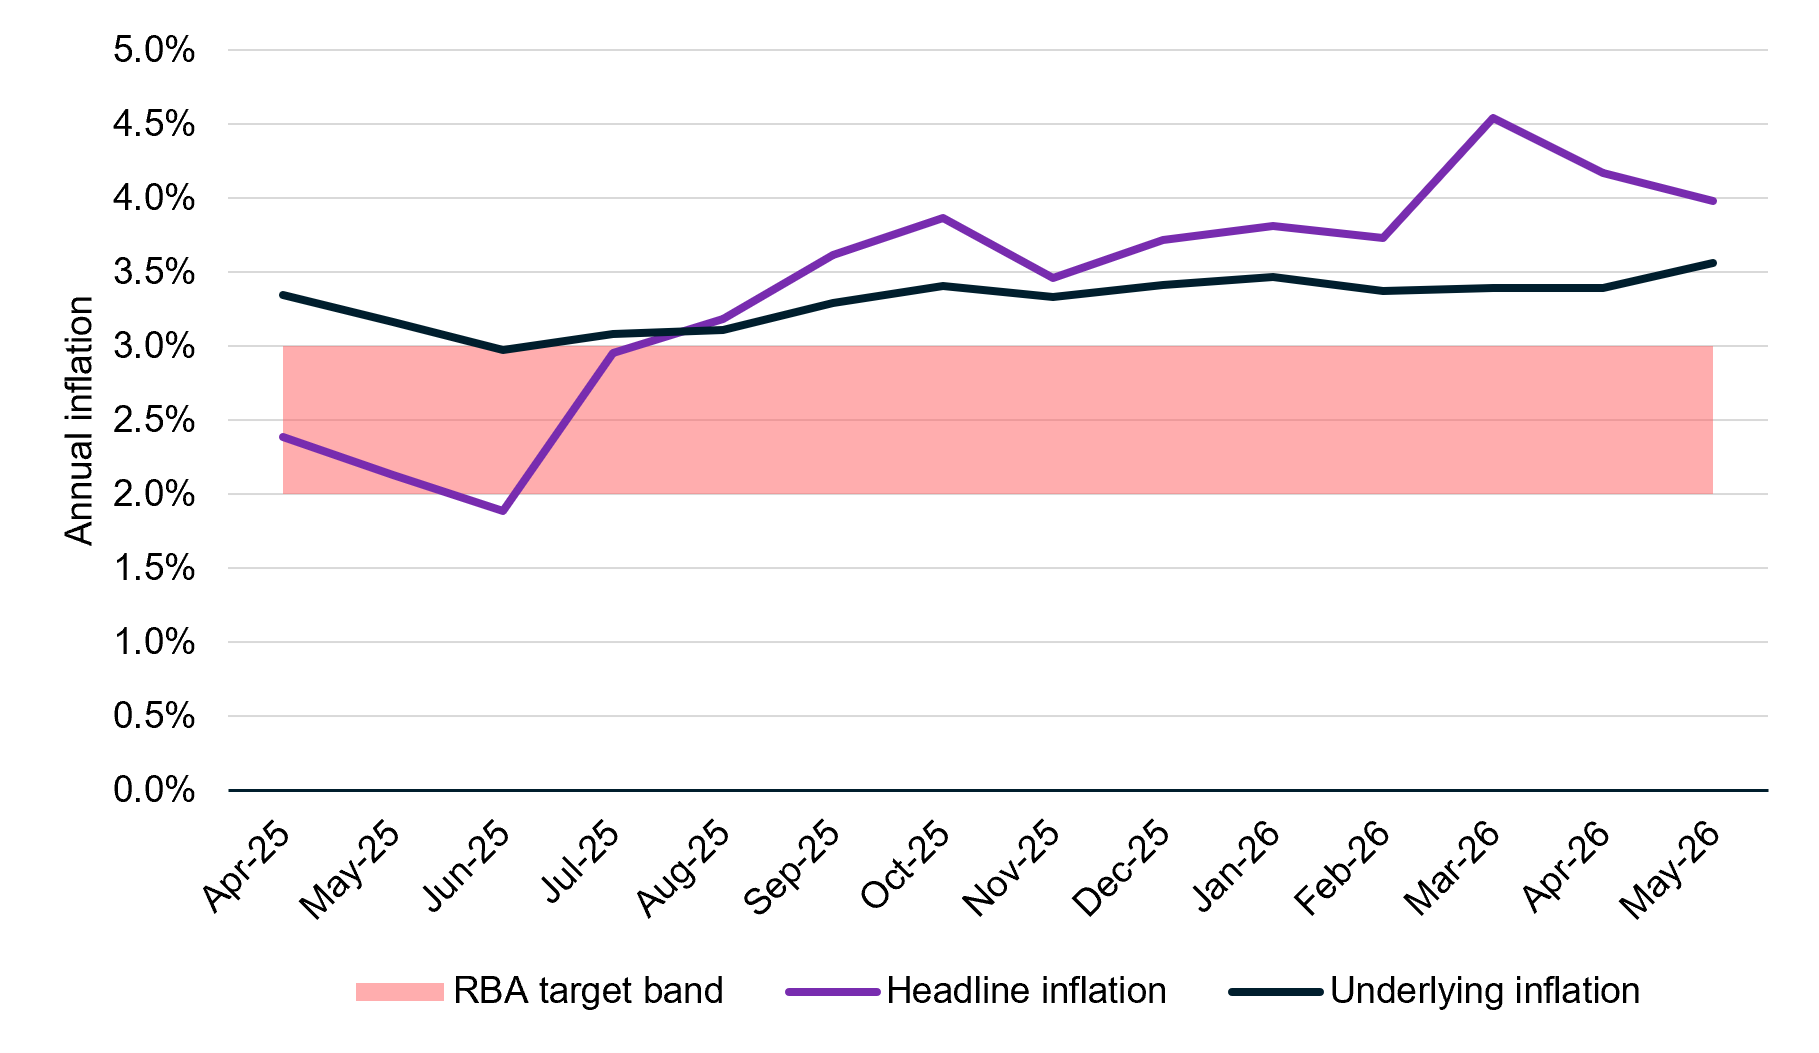
On the positive side, “tradeable” goods and services that are exposed to international trade influences have continued to decelerate to 2.5% for the year to May. This is only one part of the inflation equation. The broader question of services costs (includes rents, education, insurances etc) remains a quandary. We suspect a more meaningful economic slowdown may be needed to reduce services inflation. With labour markets remaining tight and government spending elevated, this does not seem likely in the near term. Accordingly, we expect the RBA will remain under pressure to lift rates in coming months (potentially August), absent any meaningful slowdown in consumer spending or rise in unemployment.
Labour market
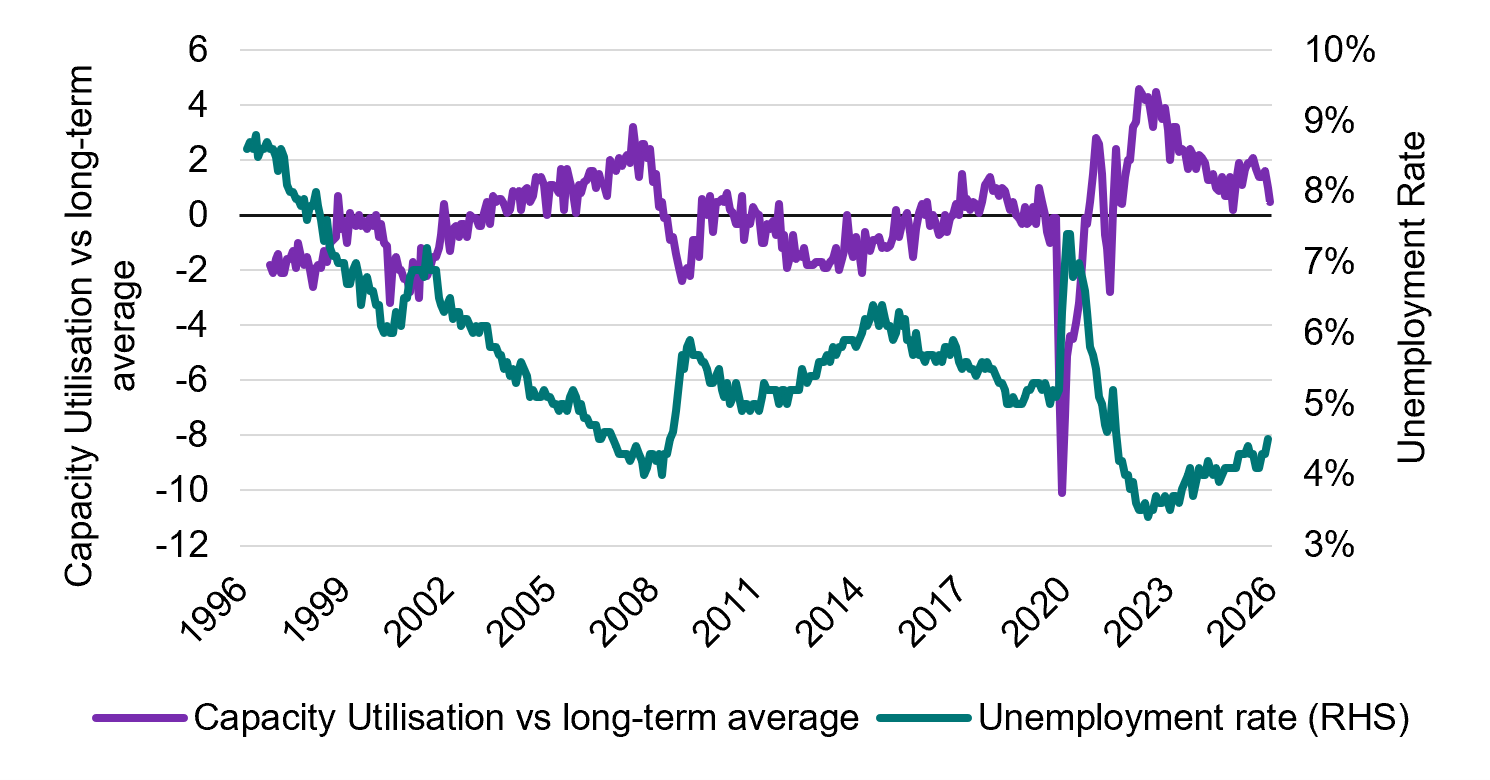
The jobs market continued to show signs of cooling consistent with weaker demand facing businesses in aggregate. Capacity utilisation, according to the NAB monthly business survey, is now only modestly above its long-term average level and consistent with higher levels of unemployment. We saw that in the May jobs report with the unemployment rate subsiding to 4.4% whilst the underemployment rate, a measure of people’s willingness to work more hours than they do currently, rose marginally to 5.9%.
Unemployment rate vs capacity utilisation (May 1996 to May 2026)
Vacancy growth as measured by the Internet Vacancy Index by Jobs and Skills Australia continue to fall, down 3.2% for the year to May with healthcare (up 3.3%) and construction (up 3.2%) notable exceptions[8]. Taken together the labour market is showing some modest signs of cooling with some weakness ahead if vacancy trends do not stabilise. Context is required. Vacancies remain structurally higher by 102,000 roles versus the pre-pandemic average; considerable demand destruction would be needed to see labour markets materially loosen.
AI investment boom
One notable tailwind that has emerged in recent quarters has been Australia’s own “AI boom”. Capital investment in data centres including the chips to power AI models have translated into a material surge in business investment spending. The information and telecommunications sector saw capital expenditure rise 96% in the March quarter with total capital investment at levels last seen during the mining boom of the early 2010s.
Annual investment spending split by sector contribution (Mar-16 to Mar-26)
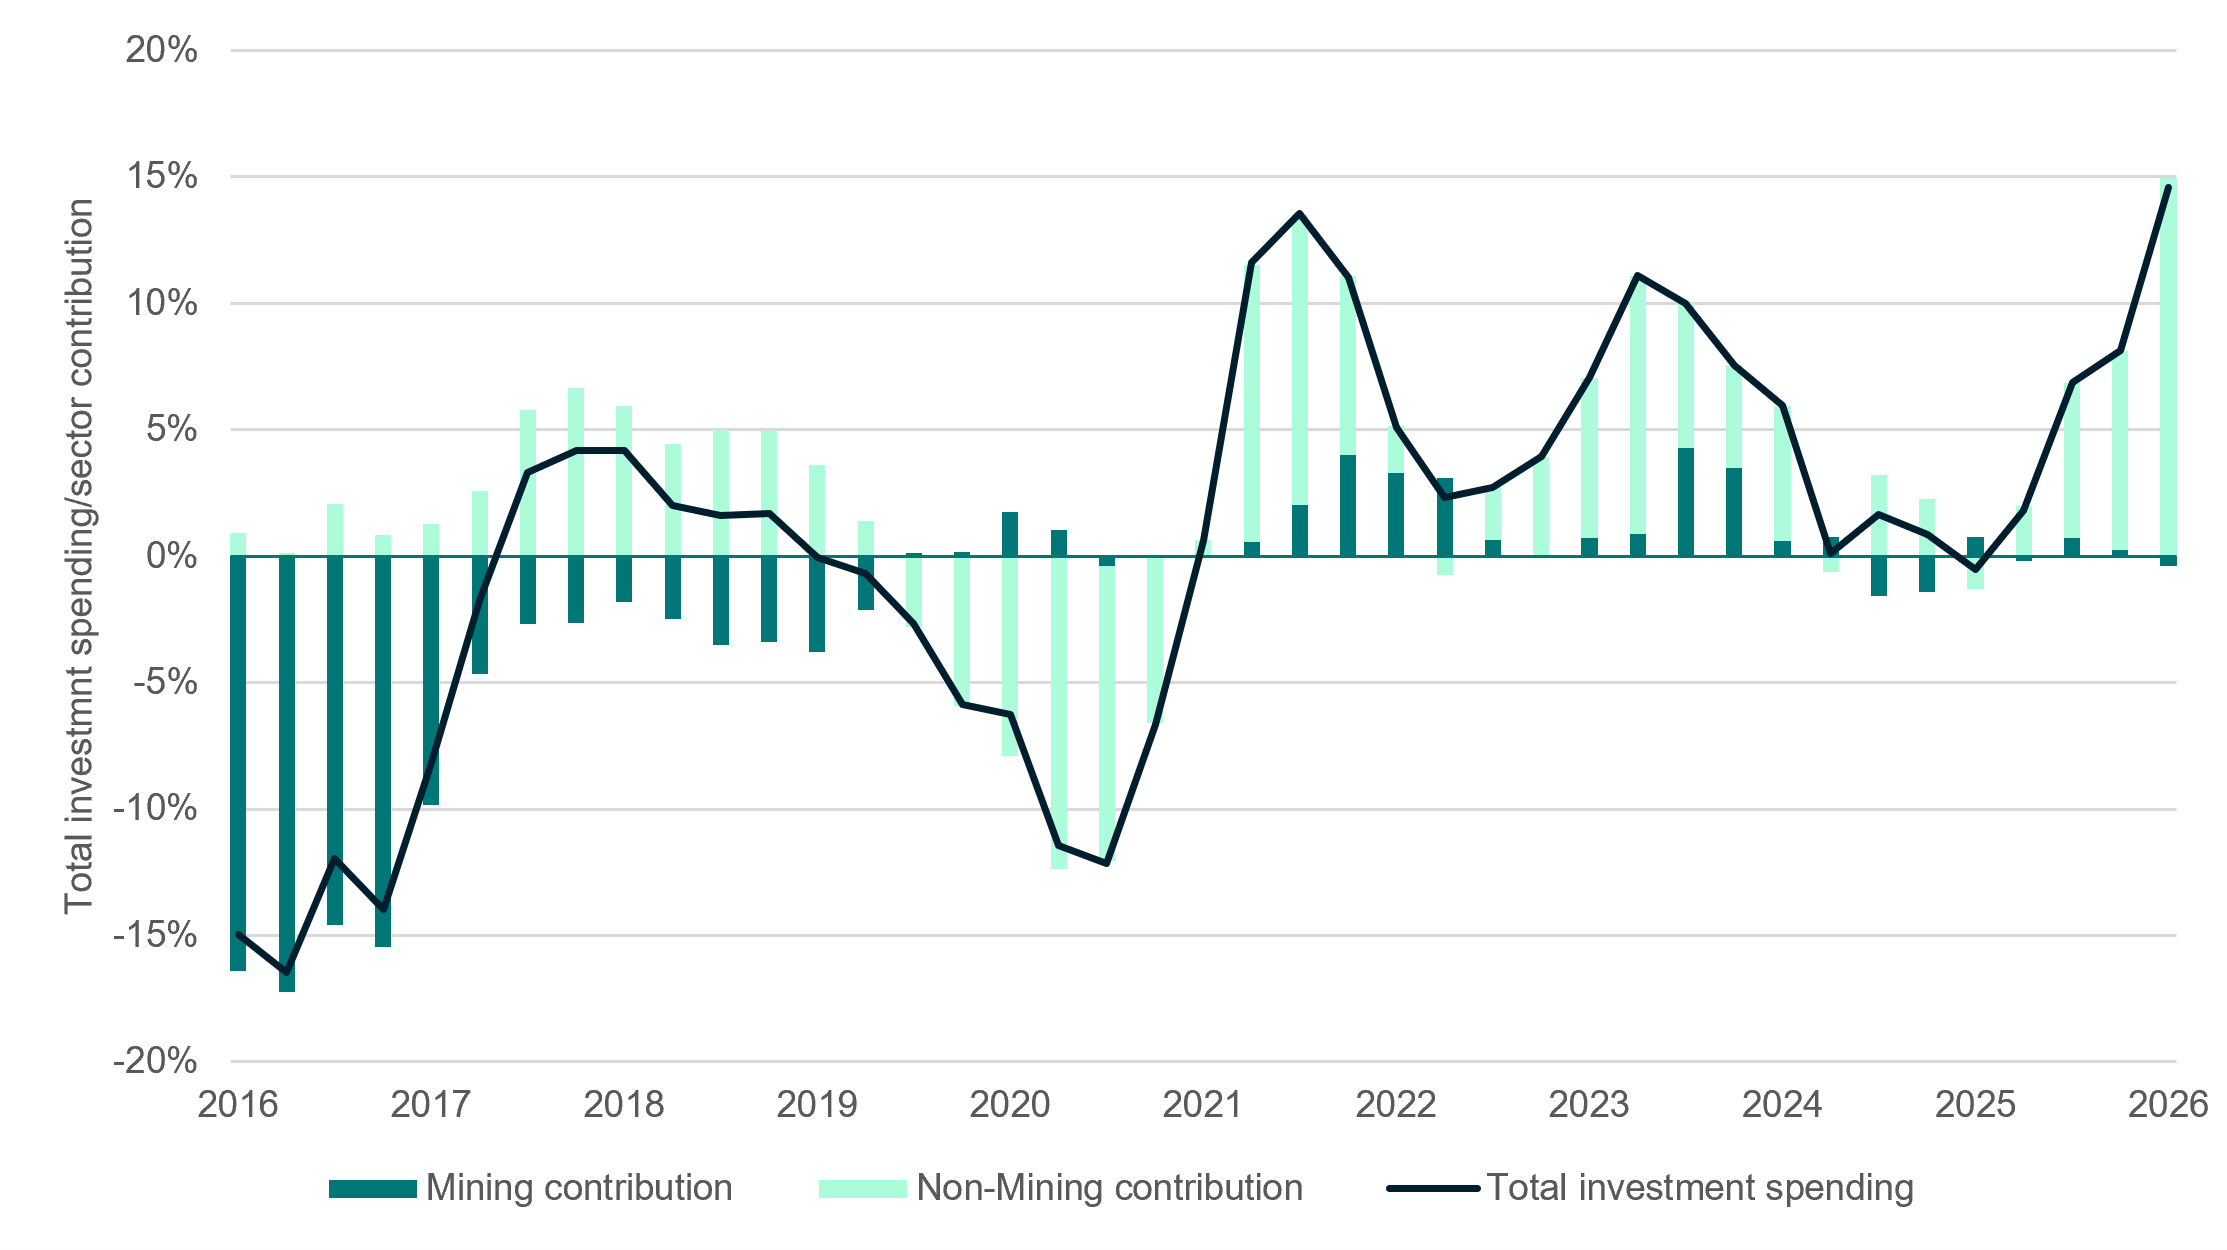
The actual impact on economic growth is less straightforward. Whilst higher investment is a boon, it also translates into a notable drag from higher imports given a lack of domestic production for chips needed to power AI. There should be positive economic spillover effects into industries such as construction with higher spending in adjacent sectors as well as additional jobs growth. Westpac Economics anticipates that these efforts could account for a $75bn tailwind (or 2.8% of one year’s GDP) over the medium term[9].
This will be a factor to watch in the quarter’s ahead as the economic boost could also translate into stronger inflationary pressures as the sector draws increasing resources from the broader economy.
Interest rates
The RBA raised its cash rate target by 0.25% on 6 May in an attempt to contain higher prices and inflation expectations. The reality of sticky underlying inflation in essential goods and services such as housing and healthcare has added to these woes in recent months.
The latest Federal Budget may stifle near-term action as we see signs of slowing credit growth emerge and this could see a more meaningful slowdown in household spending ensue. Arguably market forecasts for interest rates are reflecting this reality. Since 31 March, a period impacted by elevated energy prices from the war, we have seen rate expectations retreat materially for 2027. In part, this reflects the decline in energy prices following the April ceasefire between the US-Israel coalition, and Iran. It also reflects a growing bearishness amongst Australian commentators surrounding the Federal Budget and the threat it poses to the domestic property market.
Australian interest rate forecasts (market-implied), 26 June 2026 versus 31 March 2026
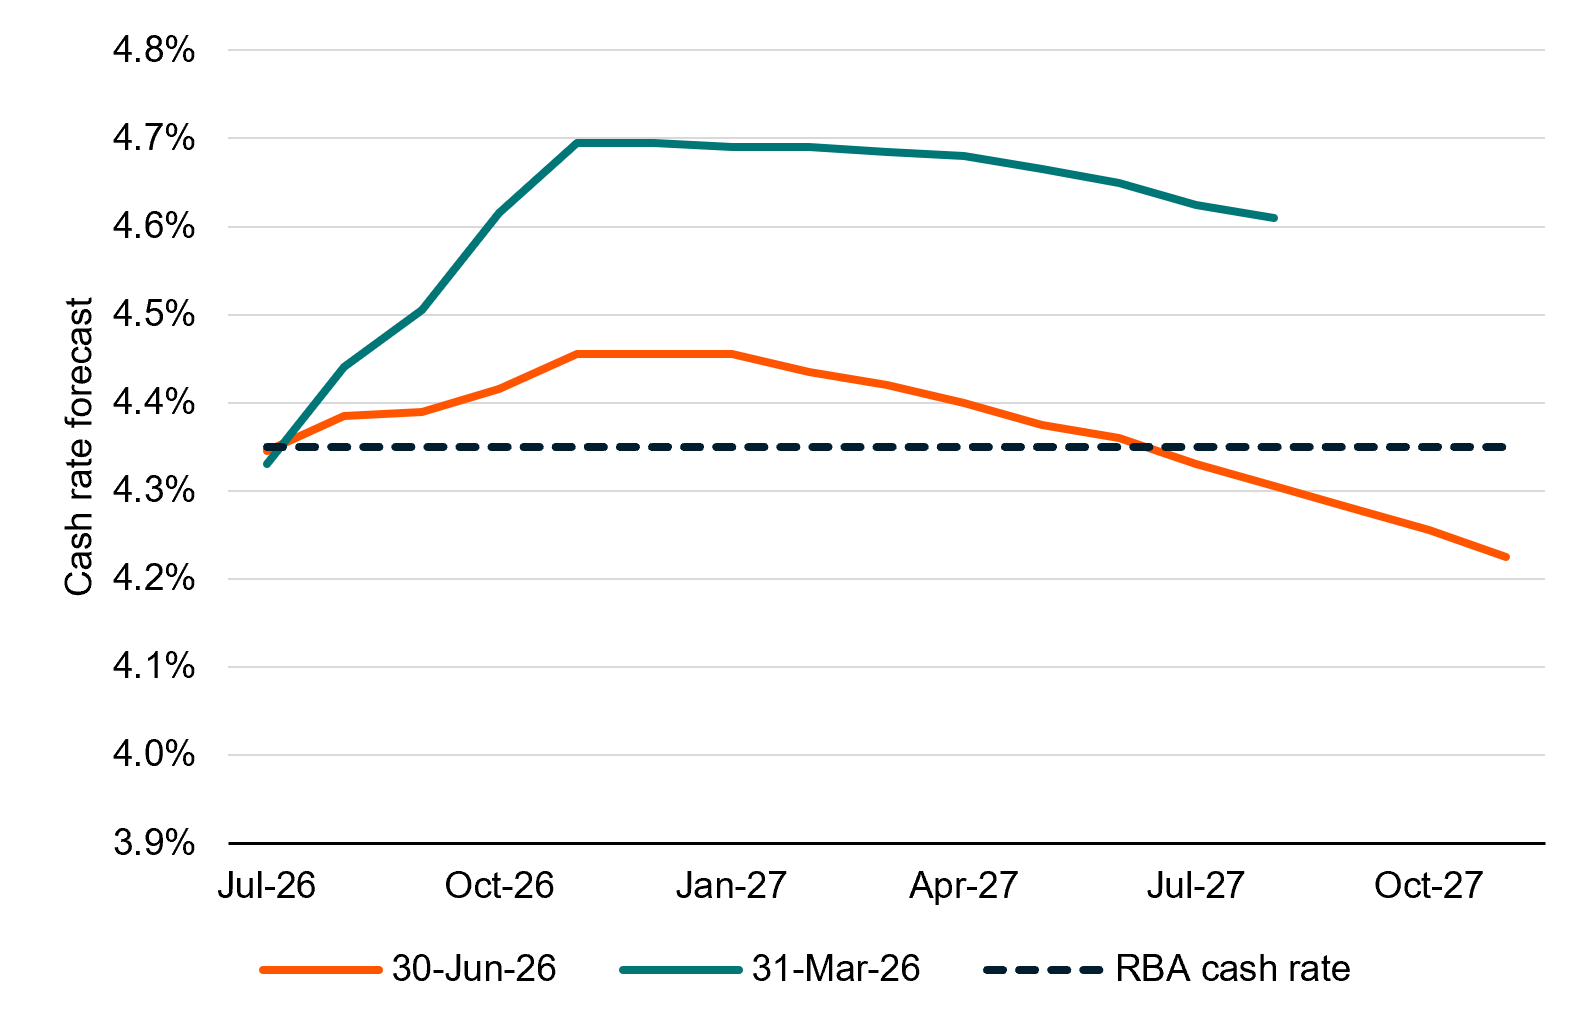
The Budget implications will take time to feed through in our view. At present the RBA remains committed to increasing rates to eliminate the risk of inflationary expectations becoming entrenched. Until we see a notable deceleration in underlying inflation there is a real, even likely, possibility of further rate hikes with the August meeting looming. At this juncture we do not see evidence of enough economic pain in the form of weaker labour market conditions or reduced household spending to convince the RBA otherwise.
Conclusion
The Australian economy is facing new challenges with the latest Federal Budget challenging our property sector in a meaningful way. While the Government may achieve its goal of making housing more affordable, this will come at a cost. Reduced demand by investors is likely to see credit growth slow and property prices fall further in the short term, which will have flow through implications for downstream businesses including building suppliers, furniture and whitegoods retailers. It is conceivable that falling asset prices may well eventually crimp household consumption over the medium term via the negative wealth effect, pushing some recent buyers into negative equity and reducing economic activity more broadly.
In the short term however, significant tailwinds persist with ongoing deficit spending, the AI investment boom, a robust labour market and a level of inflation relief should the peace deal in the Middle East hold. This should translate into modest growth in the short run, albeit with the risk of a slowdown in 2027.
Part 2: Key economic indicators
| Economic snapshot | Last reported result | Date |
| Growth (GDP) | 2.50% | Mar-26 |
| Inflation | 4.00% | May-26 |
| Interest rates | 4.35% | May-26 |
| Unemployment rate | 4.40% | May-26 |
| Composite PMI | 49.8 | Jun-26 |
| Economic snapshot | 2026e | 2027e |
| Growth (GDP) | 1.9% | 1.7% |
| Inflation | 4.2% | 2.9% |
| Interest rates | 4.35% | 4.35% |
| Unemployment rate | 4.5% | 4.7% |
| US Dollars per 1 Australian Dollar ($) | 0.72 | 0.73 |
Source: Bloomberg
[1] ‘Budget 2026-27: Care and opportunity’, Treasury (12 May 2026), Strengthening care and broadening opportunity | Budget 2026–27, (accessed 13 May 2026).
[2] ‘Federal Budget 2026/27’, Australian Industry Group (12 May 2026), Federal Budget 2026/27 – Federal Budget measures for business, (accessed 13 May 2026).
[3] C. Williams & L. Walker, ‘Queensland budget 2026: Key takeaways from ‘stability’-focused budget’, ABC News (24 June 2026), Queensland budget 2026: Key takeaways from ‘stability’-focused budget – ABC News, (accessed 26 June 2026),
[4] E. Young & N. Campanella, ‘Disability advocates welcome extension after ‘ridiculous and disrespectful’ NDIS inquiry’, ABC News (23 June 2026), https://www.abc.net.au/news/2026-06-23/ndis-bill-senate-inquiry-extended/106818164, (accessed 24 June 2026).
[5] J. Eyers, ‘Westpac investor loans plunge one-fifth on federal budget tax shock’, Australian Financial Review (11 June 2026), Westpac (WBC ASX) loans plunge on federal budget tax shock, consumer banking chief executive Carolyn McCann says, (accessed 11 June 2026).
[6] ‘Multiple headwinds to hit home prices by more than expected’, CommBank Global Economics & Market Research (3 June 2026), commbankresearch.com.au/apex/researcharticleviewv2?id=a0NOa00000KgFFF, (accessed 4 June 2026).
[7] D. Marin-Guzman, ‘Business warns 4.75pc minimum wage rise could push up inflation, rates’. Australian Financial Review (2 June 2026), Business warns 4.75pc minimum wage rise will push up prices, inflation, interest rates, (accessed 3 June 2026).
[8] ‘Internet Vacancy Index May 2026’, Jobs and Skills Australia (24 June 2026), Internet Vacancy Index (IVI) | Jobs and Skills Australia, (accessed 24 June 2026).
[9] ‘Powering the AI Economy: Australia’ $155bn Data Centre Boom’, Westpac Economics (29 May 2026), er20260529DataBulletin.pdf, (accessed 30 May 2026).