Pitcher Partners Investment Services (Melbourne) | The information in this article is current as at April 4, 2025.
As 2024 drew to a close, the consensus view from Wall Street was that the S&P 500 would reach 6,600 by the end of 2025, reflecting a gain of more than 9%. With Q1 now concluded, the story so far has not unfolded as predicted. President Trump began his second term in January, and during the quarter US trade policy proved volatile, leading to uncertainty in the markets and an erosion of investor confidence. US bond yields fell, offsetting a fall in equities, while the reverse played out in Europe.
The tech-fuelled rally in the S&P 500 over the last two years hit a stumbling block during the quarter. Fund manager surveys suggest portfolio allocations to tech are at their lowest point in two years. The ASX declined by 2.8%, with a mixed reporting season resulting in 58% of companies beating earnings expectations. The S&P 500 returned the worst quarterly result since the peak of the rate-hiking cycle in Q3 2022, with a fall of 4.6%. In contrast, the Chinese market was up 16%, driven largely by Hong Kong-listed technology companies and a less severe round of US tariffs than initially anticipated. UK and European stocks also finished in positive territory, driven by fiscal stimulus and a ramp-up in defence spending. Some European defence companies nearly doubled in value during the quarter.
The European Union revealed plans for an €800 billion increase in defence capabilities, including €150 billion in borrowings. The yield on 10-year bunds rose sharply due to the loosening of Germany’s purse strings, pulling up the costs of borrowing in other Eurozone states, while the UK announced spending cuts towards the end of the quarter. The change in approach was received positively by the equity markets, and the ECB echoed the sentiment with two rate cuts during the quarter. Amid US uncertainty, the Fed elected to leave rates on hold, and in February the RBA cut rates by 25 basis points. The return on government bonds by the end of the quarter was negative in Japan by 2.4%, Germany by 1.6%, Spain by 1.1%, and Italy by 0.7%. UK gilts returned 0.4%, and US Treasuries 2.9%.
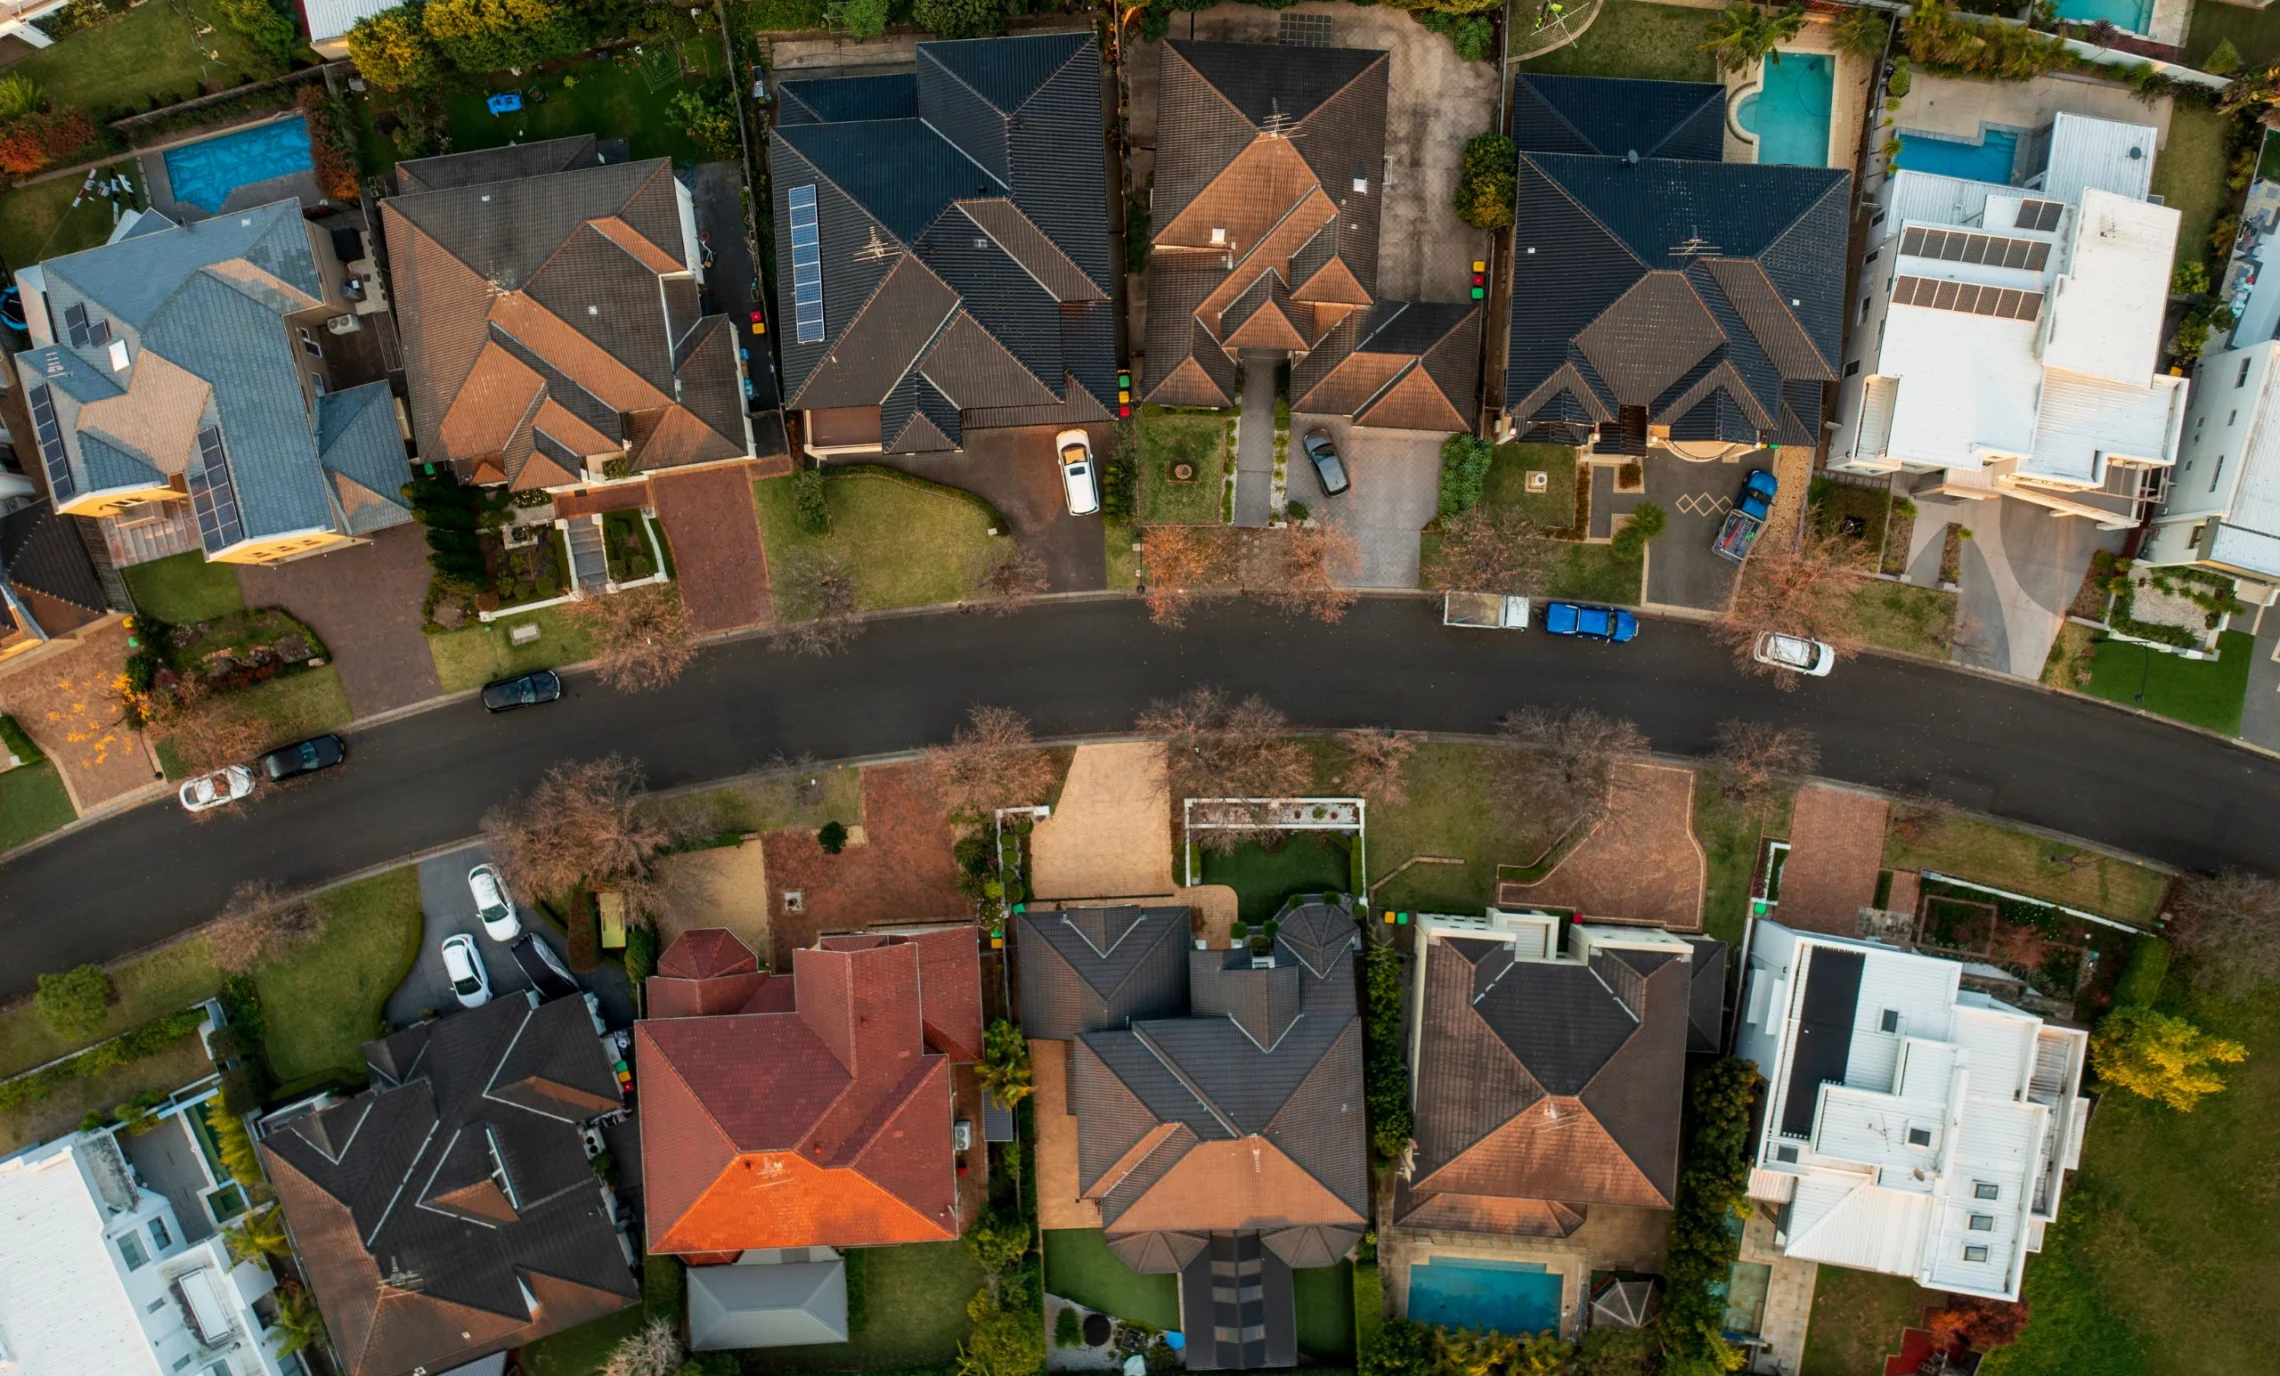
The downward trend in Australian residential property reversed course during the quarter as investors pre-empted the February rate cut and positive sentiment took hold. Prices rose by 0.7% across the nation, led by increases in all five of the major capitals. A decline in the Australian listed property index largely reflected company-specific issues rather than the general market, and retail-focused property stocks in particular gained ground. The global property index was largely flat.
Investors looked to safe-haven assets, pushing gold to historic highs during March as it broke through USD 3,000. Copper also advanced. The Australian dollar fluctuated against the USD during the quarter but finished relatively flat at around $0.62.
| Financial Markets at 31 March 2025 | |||
| Indices | Current Level | 3 Months | 1 Year |
| ASX 200 | 7,843.4 | -3.9% | -0.68% |
| ASX 200 (Acc) | 103,733.5 | -2.8% | 2.84% |
| US S&P 500 | 5,611.9 | -4.6% | 6.80% |
| Japan Nikkei | 35,617.6 | -10.7% | -11.77% |
| UK FTSE 100 | 8,582.8 | 5.0% | 7.92% |
| MSCI World (AUD) | 20,705.8 | -2.4% | 12.09% |
| German Dax | 22,163.5 | 11.3% | 19.85% |
| French CAC | 7,790.7 | 5.6% | -5.06% |
| HK Hang Seng | 23,119.6 | 15.3% | 39.77% |
| Shanghai Comp | 3,335.7 | -0.5% | 9.69% |
| ASX 200 Prop (Acc) | 72,034.6 | -6.8% | -5.42% |
| Global Prop | 2,787.3 | 0.7% | 3.62% |
| Australia 2Y Bond Yield | 3.68 | -18 bp | -8 bp |
| Australia 10Y Bond Yield | 4.38 | +2 bp | +42 bp |
| US 2Y Bond Yield | 3.88 | -36 bp | -74 bp |
| US 10Y Bond Yield | 4.21 | -36 bp | +0 bp |
| Commodities | Current Level | 3 Months | 1 Year |
| Gold (oz) | 3,123.6 | 19.0% | 40.08% |
| Oil (Barrel) | 71.5 | -0.3% | -14.06% |
| Iron Ore (Tonne) | 96.9 | 1.6% | 2.11% |
| Aluminium | 2,533.0 | -0.7% | 9.18% |
| Copper | 9,710.0 | 10.7% | -1.12% |
| Lead | 2,012.0 | 3.1% | -5.01% |
| CRB Index | 309.3 | 4.2% | 2.21% |
| Currencies | Current Level | 3 Months | 1 Year |
| AUD/USD | 0.6246 | 1.0% | -4.13% |
| AUD/EUR | 0.5774 | -3.4% | -4.36% |
| AUD/GBP | 0.4835 | -2.2% | -6.30% |
| AUD/JPY | 93.66 | -3.7% | -5.03% |
| AUD/RMB | 0.625 | 4.5% | -4.13% |
| ASX Indices | Current Level | 3 Months | 1 Year |
| S&P/ASX Small Ordinaries Index | 2,999.98 | -3.0% | -3.96% |
| S&P/ASX 200 Communication | 1,624.08 | -0.2% | 2.85% |
| S&P/ASX 200 Consumer Discretionary | 3,768.68 | -3.6% | 4.20% |
| S&P/ASX 200 Consumer Staples | 11,660.19 | -0.9% | -5.65% |
| S&P/ASX 200 Energy | 7,939.75 | -7.9% | -26.31% |
| S&P/ASX 200 Financials | 8,323.75 | -3.4% | 11.60% |
| S&P/ASX 200 Financial excluding A-REIT | 9,283.77 | -3.4% | 11.60% |
| S&P/ASX 200 Healthcare | 40,528.72 | -9.7% | -6.70% |
| S&P/ASX 200 Industrials | 7,759.85 | 1.5% | 8.06% |
| S&P/ASX 200 Information Technology | 2,260.02 | -17.5% | -0.75% |
| S&P/ASX 200 Materials | 15,975.69 | -0.9% | -10.96% |
| S&P/ASX 200 A-REIT | 1,592.92 | -7.3% | -8.64% |
| S&P/ASX 200 Utilities | 9,058.95 | 0.3% | 9.35% |
| World Indices | Current Level | 3 Months | 1 Year |
| MSCI World Value Index | 3,830.94 | 4.2% | 6.37% |
| MSCI World Growth Index | 5,312.20 | -7.9% | 4.72% |
| MSCI World Small Cap Index | 539.27 | -4.1% | -1.73% |
| MSCI World Large Cap Index | 2,312.60 | -2.4% | 6.23% |
| MSCI World Communication Services | 121.40 | -4.6% | 12.20% |
| MSCI World Consumer Discretionary | 419.09 | -10.5% | 1.20% |
| MSCI World Consumer Staples | 294.59 | 5.5% | 6.07% |
| MSCI World Energy Sector | 265.73 | 9.2% | -0.01% |
| MSCI World Financials | 193.38 | 5.5% | 18.90% |
| MSCI World Health Care | 369.01 | 4.6% | -2.39% |
| MSCI World Industrials | 413.03 | 2.0% | 4.31% |
| MSCI World Information Technology | 696.57 | -12.0% | 3.70% |
| MSCI World Materials Sector | 331.70 | 3.2% | -6.90% |
| MSCI World Utilities Sector | 174.56 | 6.6% | 16.55% |