
Key points:
-
New Vehicle Efficiency Standard (NVES) penalties are expected to materially increase vehicle prices and weekly repayments, with costs compounding through margins and taxes and narrowing consumer choice over time.
-
Dealers face significant supply volatility under NVES, forcing short-term inventory and trading decisions that may disrupt long-standing OEM relationships and accelerate shifts toward parallel imports or longer ownership cycles.
-
OEMs face structural disruption as NVES compliance collides with global product cycles and right-hand-drive constraints, potentially forcing market exits even where underlying consumer demand remains strong.
Consumers: rising costs and reduced choice
Penalties will flow through to retail pricing, increasing weekly repayments and narrowing model options. The policy’s architecture tends to enforce “groupthink,” limiting genuine choice and flexibility. For a typical $50,000 car financed at 8% APR over 4 years, average weekly repayments are projected to rise across 2026–2029 scenarios as penalties and margins are embedded in pricing.
A worked example for 2029 shows how a $3,736 NVES penalty at OEM level can translate into a $6,224 higher vehicle price and a $63,762 total purchase price, once dealer margin, GST and stamp duty are included – where 12% of the purchase price is tax (GST + stamp duty) and 10% is NVES penalties and margin. In this scenario, the original $50,000 vehicle accounts for 78% of the total purchase price.
| New vehicle purchase price 2029 | Calculation | |
| Vehicle price | 50,000 | a |
| Dealer price | 46,296 | b = a / 1.08 |
| OEM price | 42,867 | c = a / 1.08 |
| 2029 NVES penalty** | 3,736 | d |
| Tax impact | 5,336 | e = d x 0.7 |
| Total OEM price with NVES impact | 48,203 | f = c + e |
| Dealer price | 52,060 | g = f x 1.08 |
| Vehicle price with NVES impact | 56,224 | h = g x 1.08 |
| GST | 5,622 | i = h x 0.1 |
| Stamp duty | 1,915 | j |
| Total tax | 7,537 | k = i + j |
| Total purchase price | 63,762 | l = h + k |
| Vehicle price % of purchase price | 78% | a / l |
| % Increase in vehicle price (NVES Penalty + Margin) | 10% | (h – a) / l |
| Tax % of purchase price | 12% | k / l |

Dealers: hostages to supply volatility
Dealers face unprecedented supply chaos, forced to trade across OEMs to maintain compliant inventory and sales. Long‑term relationships and alignment may be sacrificed for short‑term survival. If NVES drives consumers toward parallel import supply channels, new vehicle volumes could decline materially (as grey imports did in New Zealand during 2002–2012, making up 60–70% of new registrations according to FCAI commentary). Consumers may hold vehicles longer, extending purchase cycles.
OEMs: strategic disruption and forced exits
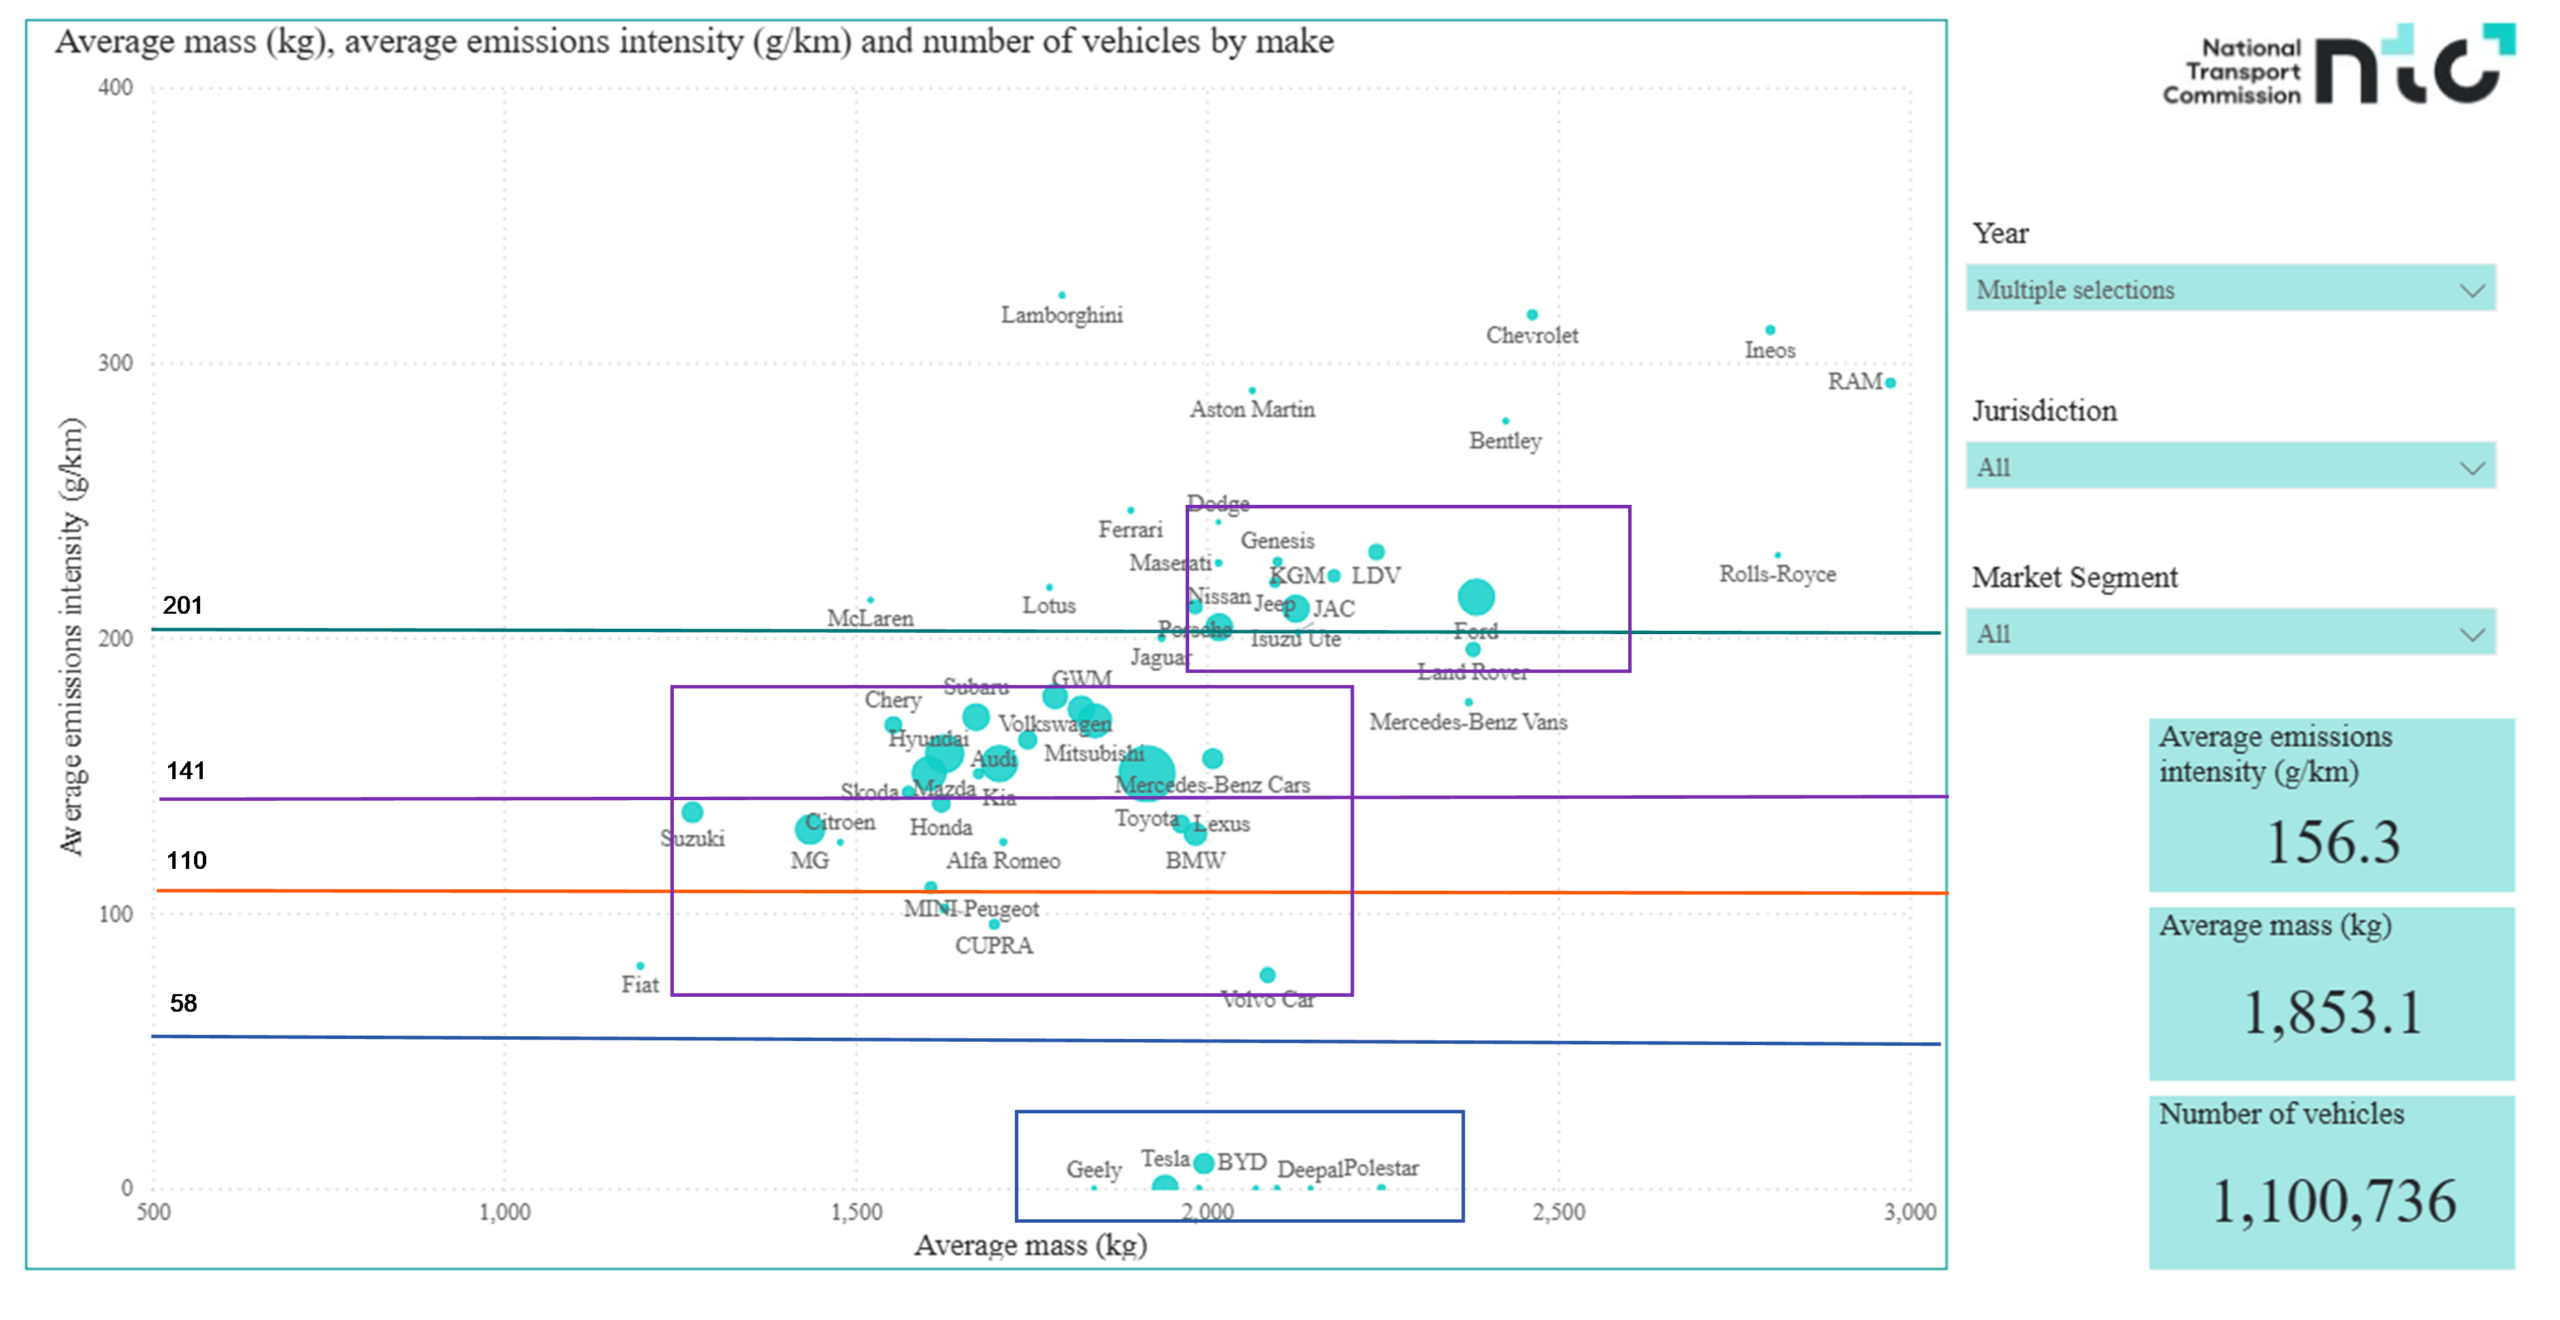
The above chart, from the NTC report, shows the relative average emissions intensity to average mass (Mass in Running Order or MIRO) for the brands sold in CY24 and Jan 2025. The overall average emissions intensity was 156.3 g/km for the new vehicles sold in the period. It shows how the brands performed comparatively to the NVES targets in 2025 and 2029.
Australian operations of global OEMs are being hijacked by compliance requirements—often misaligned with global manufacturing platforms in three areas:
- model cycle timing,
- drivetrain availability, and
- right‑hand drive market relevance.
Some OEMs may exit despite underlying demand if compliant supply cannot be secured at competitive prices. Penalties under different reduction pathways (10% vs ~2.5% historic) increase sharply, raising questions about how collected “carbon tax” equivalents are spent or recycled.
More resources