
Inflation – Recap
When an economy is growing and unemployment is low, inflation is an expected by-product. Low unemployment means businesses compete harder for workers, gradually leading to wage growth. Wage growth then means people have more money to spend on goods and services (i.e. demand). When rising demand outpaces supply, the price of these goods and services increases (i.e. inflation). To avoid instability, Governments seek to control inflation and have using two broad tools at their disposal:
- Fiscal policy: Reducing government spending i.e. infrastructure, schools and healthcare, or increased taxation.
- Monetary policy: Increasing short-term interest rates. This is intended to translate into higher loan costs for consumers and businesses, reducing their spending and putting downward pressure on demand.
The Consumer Price Index (CPI) is the most well-known measure of inflation and is updated regularly to reflect the cost of living for every-day Australians.
Groups in the CPI basket and their weights
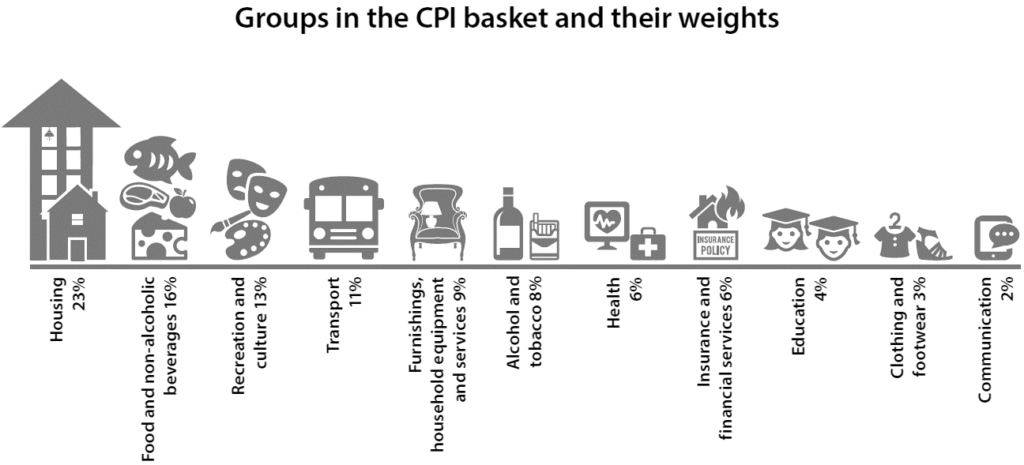
Source: Reserve Bank of Australia, Inflation and its benefits [online], https://www.rba.gov.au/education/resources/explainers/inflation-and-its-measurement.html., (accessed 9 March 2022).
What is stagflation?
Stagflation occurs when an economy is contracting while inflation and unemployment are rising. Although the economy is slowing, the increasing cost of living (inflation) leads to workers continuing to seek wage increases. The increasing input costs for business can contribute to higher unemployment, and the contractionary cycle continues.
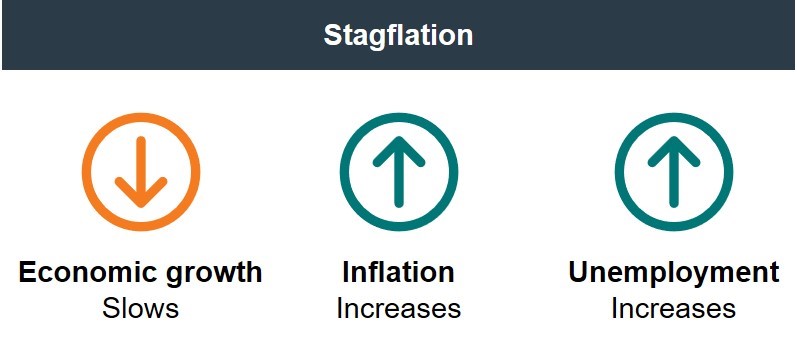
Source: Business Insider, What is stagflation? The economic phenomenon that stifled growth through the 1970s [online], https://www.businessinsider.com.au/stagflation?r=US&IR=T., (accessed 9 March 2022).
This last occurred in Australia in the 1970’s. In Graph 1, we can see inflation peaked above 15% in the mid-1970’s, which is well-above anything we have seen in the decades since. The International Monetary Fund believes this was caused by “the interaction of commodity price booms in the early 1970s … with the wage-bargaining system”1. It is also believed that central banks of the time may have contributed by not aggressively increasing interest rates.
Graph 1: Historic inflation in Australia
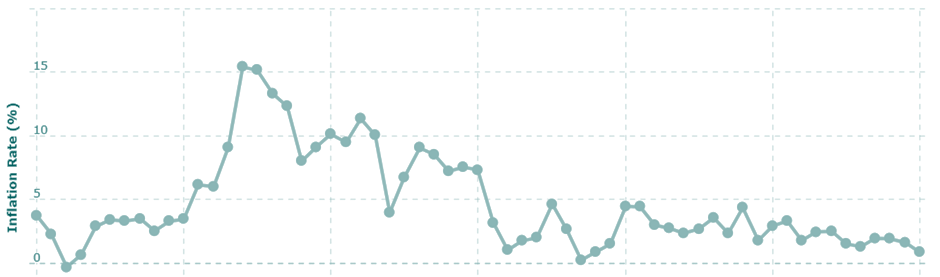
Source: Macrotrends, Australia Inflation Rate 1960-2022 [online], https://www.macrotrends.net/countries/AUS/australia/inflation-rate-cpi., (accessed 9 March 2022).
During the 1970’s annual GDP growth was also slowing from the higher rate of growth experience in the 1960’s.
Graph 2: GDP growth in Australia 1970 to 1980
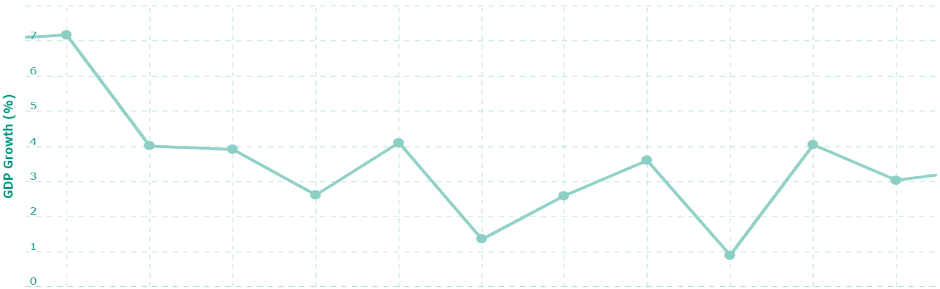
Source: Macrotrends, Australia Inflation Rate 1960-2022 [online], https://www.macrotrends.net/countries/AUS/australia/gdp-growth-rate., (accessed 9 March 2022).
This environment put the government in a difficult position; fiscal and monetary policy that could be used to fight inflation would also cause the economy to contract further.
What are we seeing now?
Some market commentators believe that inflation may soon be out of control. Energy prices have increased, exacerbated by the risk of further sanctions on Russia, who represent 11% of the world oil supply2. Reduced oil production would only increase prices further and could slow economic activity. While oil prices have increased year-on-year, and may increase further, we have not yet seen prices on a scale of that seen in the 1970’s (see Graph 3).
Covid-induced global supply chain closures, as well as a broader reversal in globalisation, has led many companies to onshore key parts of their business – at greater cost. This adds to inflationary pressure while also reducing the growth prospects of emerging economies.
While we do expect growth to decline from recent levels, the elevated growth rate is due in-part to the closure, then re-opening of global economies.
Graph 3: Annual increase in Crude Oil Prices
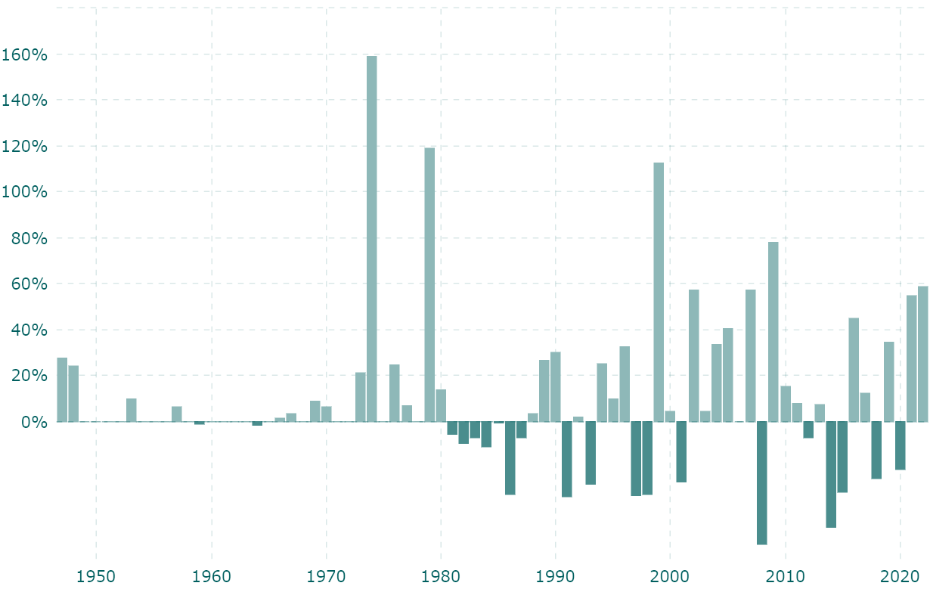
Source: Macrotrends, Australia Inflation Rate 1960-2022 [online], https://www.macrotrends.net/1369/crude-oil-price-history-chart., (accessed 9 March 2022).
Conclusion
In the long-run, it remains unknown whether inflationary pressures will be sustained. Some believe that governments have been too slow to unwind the extraordinary measures taken to stimulate the economy during the pandemic induced lockdowns, and that this has already fuelled the fire for longer-term inflation. Conversely, others believe the current inflationary pressures to be short-term induced by disrupted global supply chains. As supply chains re-open, inflationary pressures may recede with Australia returning to the low inflationary and low growth environment of the years prior to the global pandemic beginning in 2020.
In our opinion, remaining diversified during periods of heightened uncertainty is key. Speculation will continue but few, if any, can accurately predict what will happen in the future. The best way to protect your wealth is to hold a range of assets that can continue to perform well on a relative basis, while not being overly exposed to any one single economic outcome.
1 B, R, ‘Inflation and Monetary Policy Reform’ IMF eLibrary, Australia, 1998, https://www.elibrary.imf.org/view/books/071/00479-9781557757326-en/ch05.xml#:~:text=Consumer%20Price%20Inflation,-(Annual%20percentage%20change&text=Australia’s%20propensity%20for%20high%20inflation,with%20the%20wage%2Dbargaining%20system, (accessed 9 March 2022).
2 ‘What countries are the top producers and consumers of oil’, Energy Information Administration’, U.S, https://www.eia.gov/tools/faqs/faq.php?id=709&t=6, (Accessed 9 March 2021).
Liability limited by a scheme approved under Professional Standards Legislation. Any advice included in this newsletter has been prepared without taking into account your objectives, financial situations or needs. Before acting on the advice you should consider whether it’s appropriate to you, in light of your objectives, financial situation or needs. You should also obtain a copy of and consider the Product Disclosure Statement for any financial product mentioned before making any decisions. Past performance is not a reliable indicator of future performance. Advisors at Pitcher Partner Sydney Wealth Management are authorised representatives of Pitcher Partners Sydney Wealth management Pty Ltd, ABN 85 135 817 766, AFSL number 336950.