Time to Concentrate on Concentration
Pitcher Partners Investment Services (Melbourne) | The information in this article is current as at 22 May 2024
In the spirit of Easter, the old adage of ‘don’t put all your eggs in one basket’ can be a wise lesson to apply to investing.
Whilst concentration risks are nothing new to those who invest in Australian equities, we highlight that concentration levels are elevated or building across a number of key asset classes for investors. Whether it be the ‘Magnificent 7’ in the US, ‘GRANOLAS’ in Europe, Goodman Group in A-REITS, structure of our local bond market and more – all are increasingly influencing both absolute and relative return outcomes for investors.
In this note we discuss the approach that different investors take with respect to concentration risks, highlight some of the imbalances within certain assets classes, with a particular emphasis on global equities, comparing the current distortions with those in the past and ultimately, what should investors be thinking about when building or reviewing their portfolios.
Concentration risk refers to a large intended and/or unintended exposure to a specific investment factor, such as an individual stock, size bias, sector, country, style, region, thematic, currency position among others. The risk being that this singular position dominates the overall portfolio’s risk and/or return profile, dwarfing that of the contribution made by other investments in that portfolio.
Most local investors would be well aware of the concentration risks inherent within our local share market, with the resources and banking sectors in the S&P/ASX 200 Index ranging between ~50-70% over the past 30 years. The largest single holding within the index in recent years rotating across BHP, CSL and CBA.
With this index typically representing the ‘proxy’ asset class benchmark for Australian equities, one of the main questions that investors always face is what allocation should be made to these sectors or stocks – given the inherent bias with this proxy.
As a general rule, institutional investors such as industry funds and large broadly diversified managed funds tend to manage their Australian share portfolios within a relatively tight band around the index, otherwise known as an ‘index aware’ approach. This strategy will generally protect them from underperforming the index to a material extent, but on the flip side, their ability to outperform in a meaningful way can also be constrained. Managing increasingly large amounts of money amid widescale public scrutiny on its performance vs peers and benchmark has entrenched this investment approach.
A criticism of an index-aware approach is that it can force the investor to have an exposure to businesses or industries where perhaps the investment fundamentals (i.e. quality of earnings growth, valuation, balance sheet strength) may not justify the allocation an investor is forced or compelled to hold. Additionally, this approach forces institutional investors to view investment risk as a deviation away from their index weight (commonly referred to as tracking error), rather than as a more distinct or absolute perspective.
Non-institutional investors, ranging from High Net Worth to retail investors, generally adopt a more concentrated approach to investing and view risk in a more absolute manner – i.e. ‘you make money or lose money’. While there are always deviations from the rule, portfolio construction tends to be more concentrated in individual positions (including managed funds) – either on an absolute basis or relative to the composition of an index.
Whichever approach, the concentration risks that arise from either a benchmark ‘aware’ or ‘unaware’ approach play a material role in explaining how portfolios perform.
Beware of concentration within individual asset classes
Whilst we may have a greater understanding of the composition of own local share market, you may be surprised to find out that many other asset classes also carry their own concentration risks. Goodman Group (GMG) represents ~38% of the domestic A-REIT index (which consists of only 22 stocks). 92% of the index we use for Australian fixed interest relates to Government or semi-Government debt. Hybrid securities which are very popular among non-institutional investors do not feature in this index at all.
Globally, many individual investment markets can have these issues as well. The market capitalisation of Novo Nordisk is greater than the entire GDP of the country of its listing, Denmark. Taiwan Semiconductor (TSMC) consists of ~45% of the MSCI Taiwan Index.
Generally, the benchmarks we use for offshore asset classes tend to be more diversified, especially for underlying securities. For global equities, stock market concentration has risen dramatically in the last ten years, given the dominance of the US equity market, the rise of the technology sector and the emergence of more dominant businesses within Europe and Japan.
Given the emerging risks and opportunities that are emanating from these concentration trends, we focus the rest of this note to place these moves into historical context, why they have happened and ultimately, how should you be thinking about these issues with respect to your own portfolios.
According to the World Federation of Exchanges, it is estimated that at the end of 2023 there were ~55,214 companies that were listed on national stock exchanges around the world.
If we filtered down these businesses to make them more investor friendly, taking into account size, liquidity, governance, fundamental and other criteria, MSCI have created a broad global benchmark called the MSCI All Country World Index (ACWI) which contains just ~2919 companies, but on a size basis (market capitalisation) represents ~85% of the global investable equity opportunity set.
As at February 2024, the US represented ~65% of the MSCI ACWI. It lowers to 50% of all global equity market capitalisation.
Chart 1.
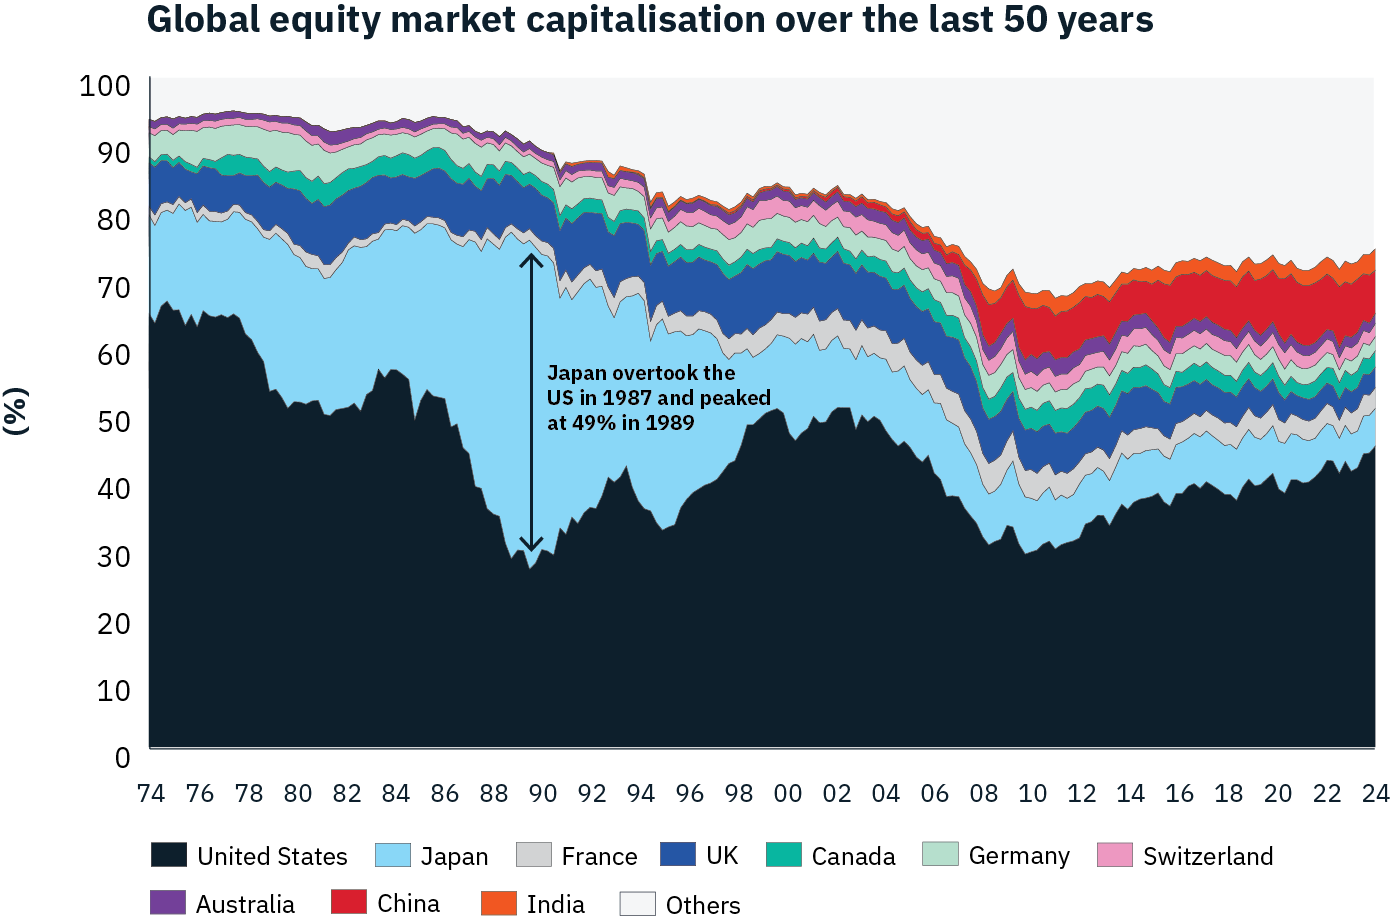
Source: Goldman Sachs Global Investment Research
Dominance of the US Share Market
The US has long been the biggest single country within the global equities asset class, with only one period challenging that dominance – the Japan market bubble in the late 1980s. Japan has shrunk significantly as a percentage of the global equity universe since that time, with the Nikkei having only just recently passed its peak index level that was originally reached some 35 years ago.
Since the Global Financial Crisis (GFC) post 2009, the US equity market has outperformed every major country’s equity market. Strong economic growth, robust earnings growth, a willingness for companies to reinvest capital back into the business at a high rate of return, especially for the technology sector have all contributed. Lower interest rates for the majority of the last decade have also supported the performance of growth stocks.
The US market tends to have superior liquidity, which also helps lower its overall risk premium compared to other regions, including emerging markets. Additionally, many global businesses tend to have high economic exposures to the US (~60% of Stoxx Europe 600 companies vs just 29% from S&P500 businesses). As a result of these favourable dynamics, many global companies are preferring to list in the US rather than other countries, which is compounding these growth differentials vs the rest of the world.
The Rise of Technology
It may not be a surprise to many that the Technology sector, as a component of many regional global equity indices has growth significantly and not just in the US
Chart 2. Chart 3.
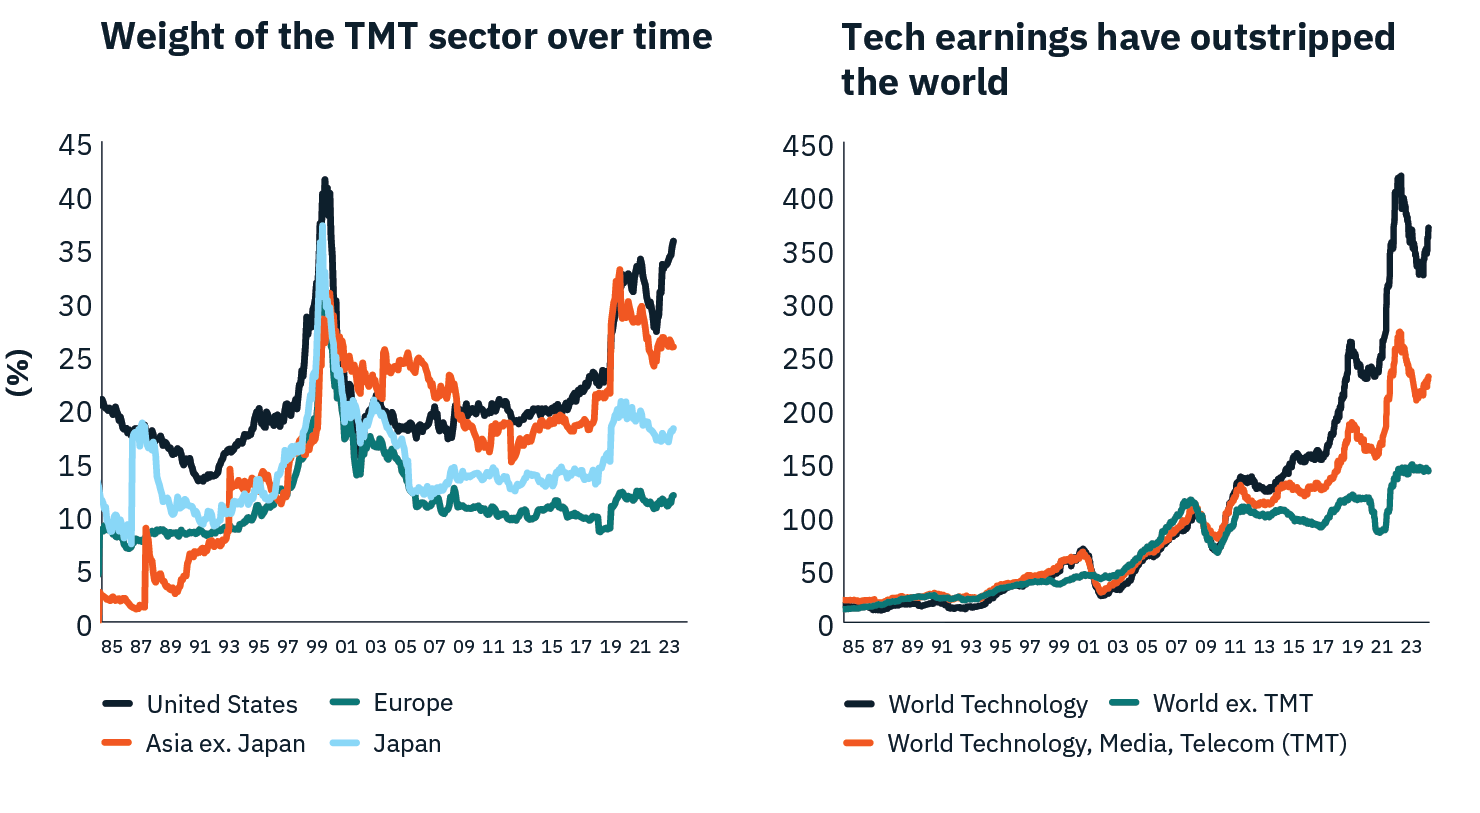
Source: Morningstar, Worldscope
As Chart 2 indicates, it isn’t just entirely due to hype or mania around digitisation, and AI etc. It’s because the sector has grown its earnings considerably, especially relative to other industries and sectors which haven’t moved very much at all over the last ten years. This was also compounded through the pandemic due to the increased demand for technology relative to other parts of the economy.
Higher interest expenses and fading demand has eroded profits of many listed companies in recent years. However, the most successful and largest technology companies have built very high cash surpluses, focused on cost reduction and have been able to reinvest back into their business at high rates of return without taking on costlier debt.
Technology’s dominance by size isn’t unique compared to the past. It’s reached a similar peak to that of the energy sector during the oil boom era of the 1950s and 1970s. Railroads, banks and property has dominated previous phases of the US listed market concentration.
Chart 4.
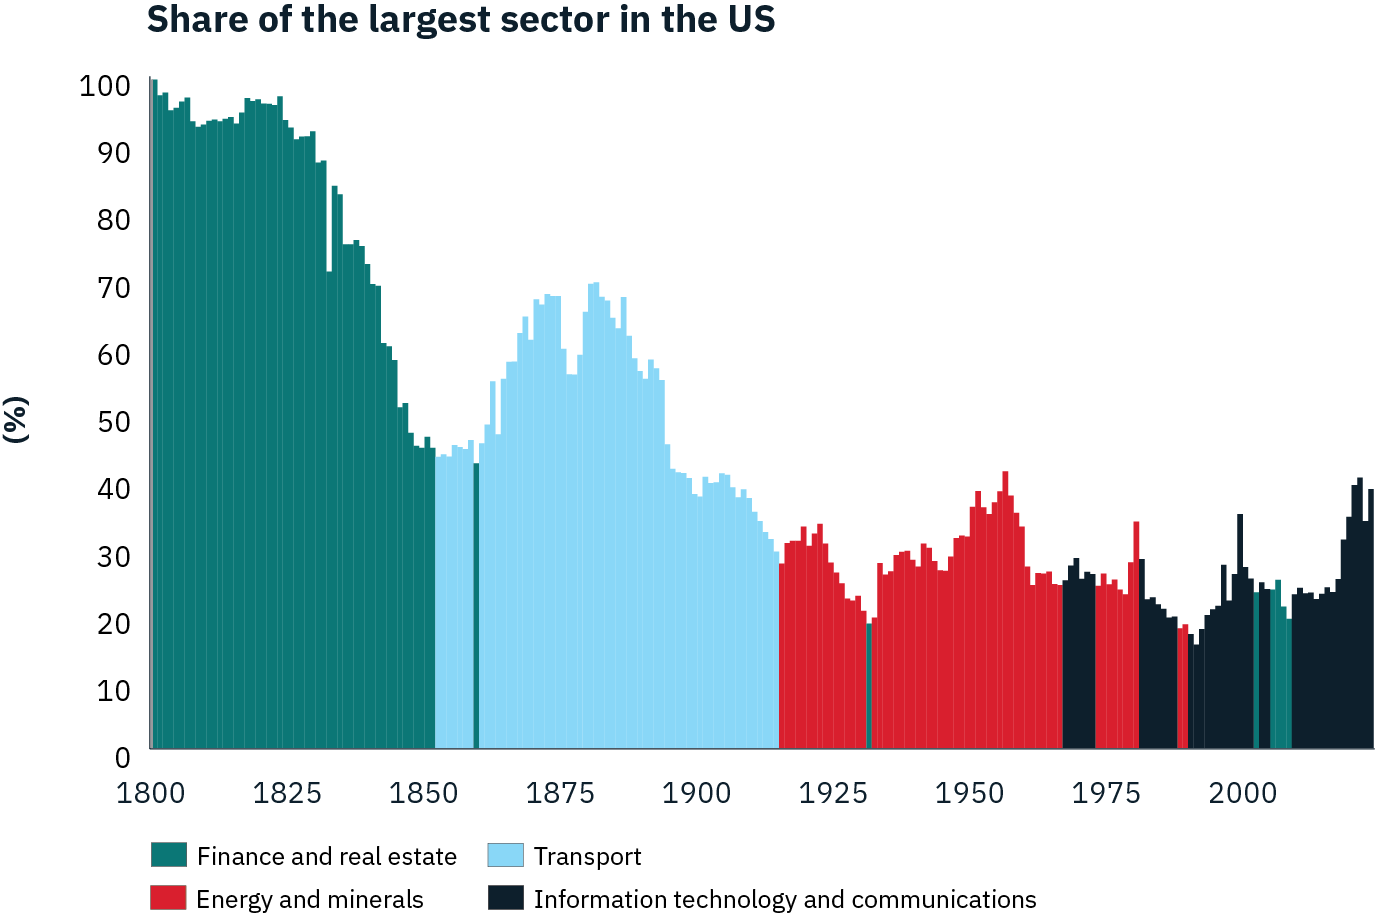
Source: Datastream
Stock concentration
While we have examined country and sector concentration, perhaps the most widely discussed issue currently is around stock concentration.
The much publicised ‘Magnificent 7’ in the U.S (Nvidia, Microsoft, Apple, Meta, Alphabet, Tesla and Amazon) have helped propel the weight of the top 10 companies of the S&P500 to over 30%, the highest level in the last 45 years.
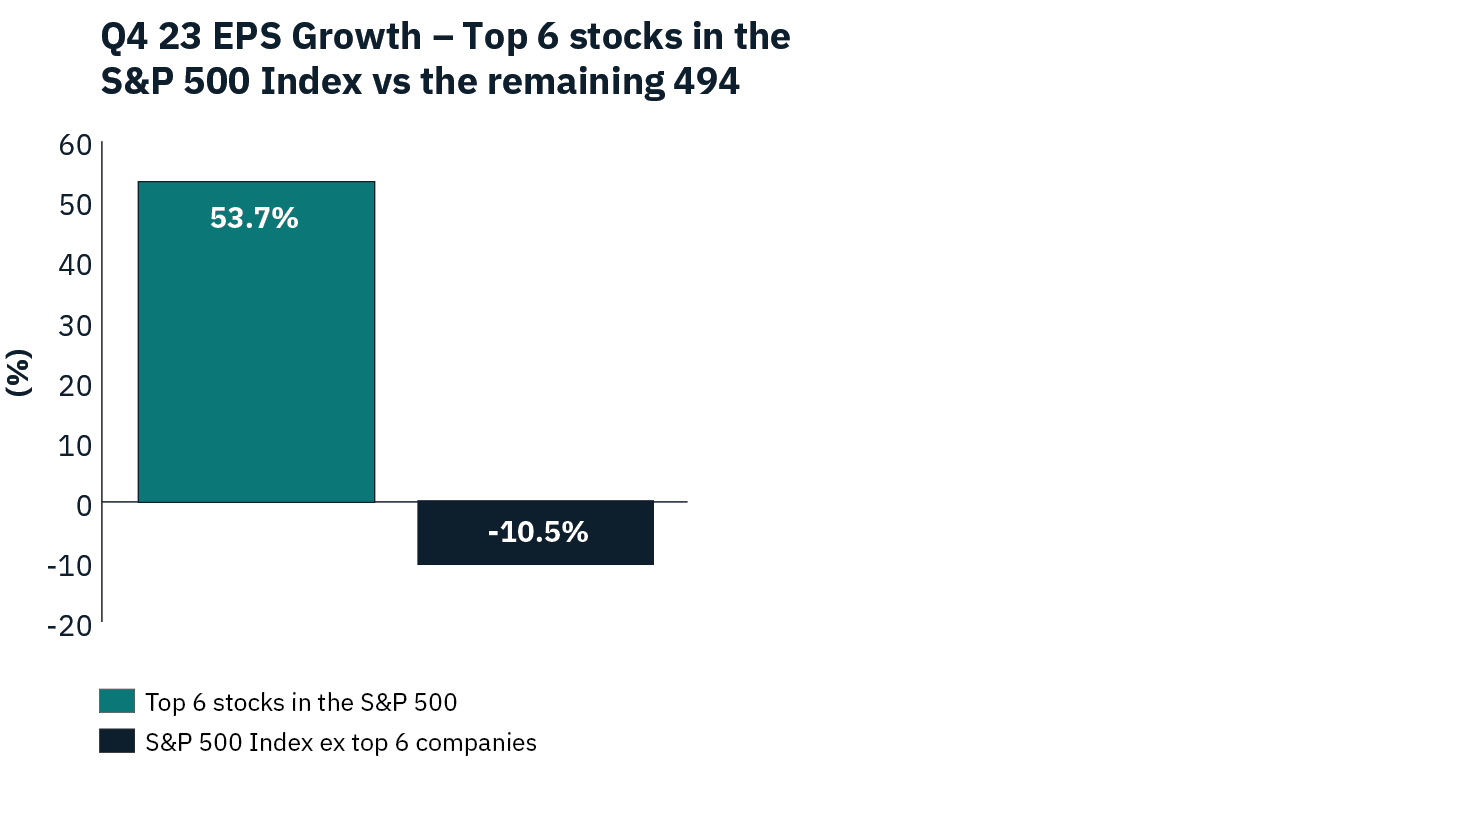
From an earnings perspective, if we exclude Tesla, these businesses saw their earnings rise ~54% in Q4 23 on average, with the remaining 494 companies generating an earnings decline of ~11%.
Chart 5.
Source: BCA Research
The size of the single largest US stock in the index has also grown to the highest level seen in the last 40 years, however it’s not a unique occurrence when taking an even longer look at history. It is worth highlighting that many investors in US and global equities are currently dealing with the greatest levels of stock concentration risk in their investing lifetime.
Chart 6.
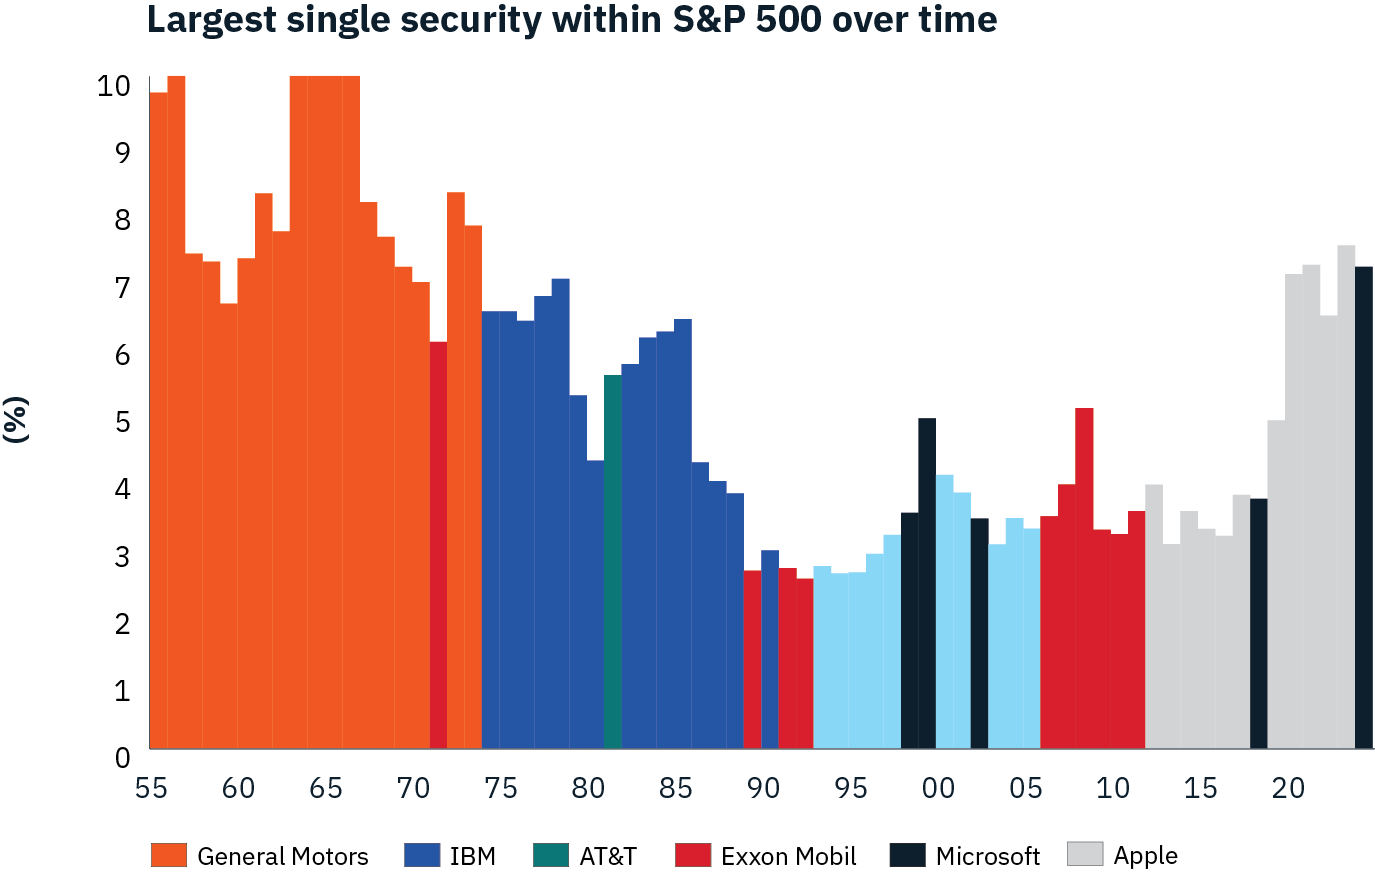
Source: Goldman Sachs Global Investment Research. Market capitalisation for businesses post 1974, Net income used for Pre 1974 data.
We also want to highlight one element that gets lost in the headlines of the ‘Magnificent 7’. That is the rising concentration levels occurring within Europe and Japan.
The financial services industry does have a rather annoying trait of issuing acronyms at the drop of a hat. In Europe, ‘GRANOLAS’ (Glaxo Smith Klein, Roche, ASML, Nestle, Novartis, Novo Nordisk, L’Oreal, LVMH, Moet Hennessy, AstraZeneca, SAP and Sanofi) have generated an even higher proportion of their benchmark’s return than what the ‘Magnificent 7’ have done on a CYTD basis, as well as over the last two years.
.
Chart 7.
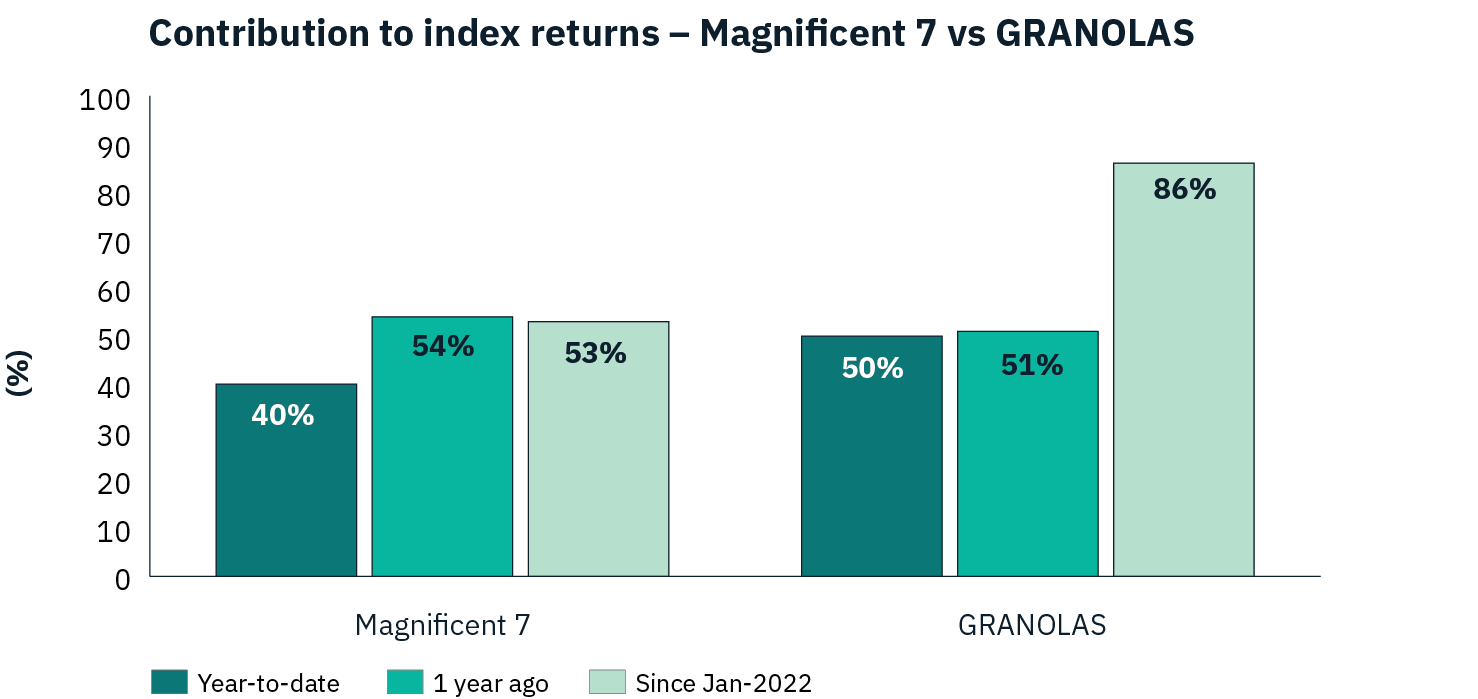
Source: Morningstar
In Japan, the top 30 companies in the Topix (~2000 companies in total), have moved from the low 30% range to now represent over 40% of the index. On a percentile basis, this is actually the same quantum in movement as the ‘Magnificent 7’!
What does this all mean?
Does this rising concentration effect around the world indicate we are perhaps in a bubble? Is it at risk of bursting? Valuations have certainly risen, especially within Japan and pockets of Europe. While the US is also priced at a premium, it’s also worth highlighting that the underlying fundamentals of the ‘Magnificent 7’ are certainly superior to those witnessed in the leading stocks in the dot com boom, as the table below highlights.
Table 1. Comparison of fundamentals – Magnificent 7 vs Dot Com Bubble Leaders
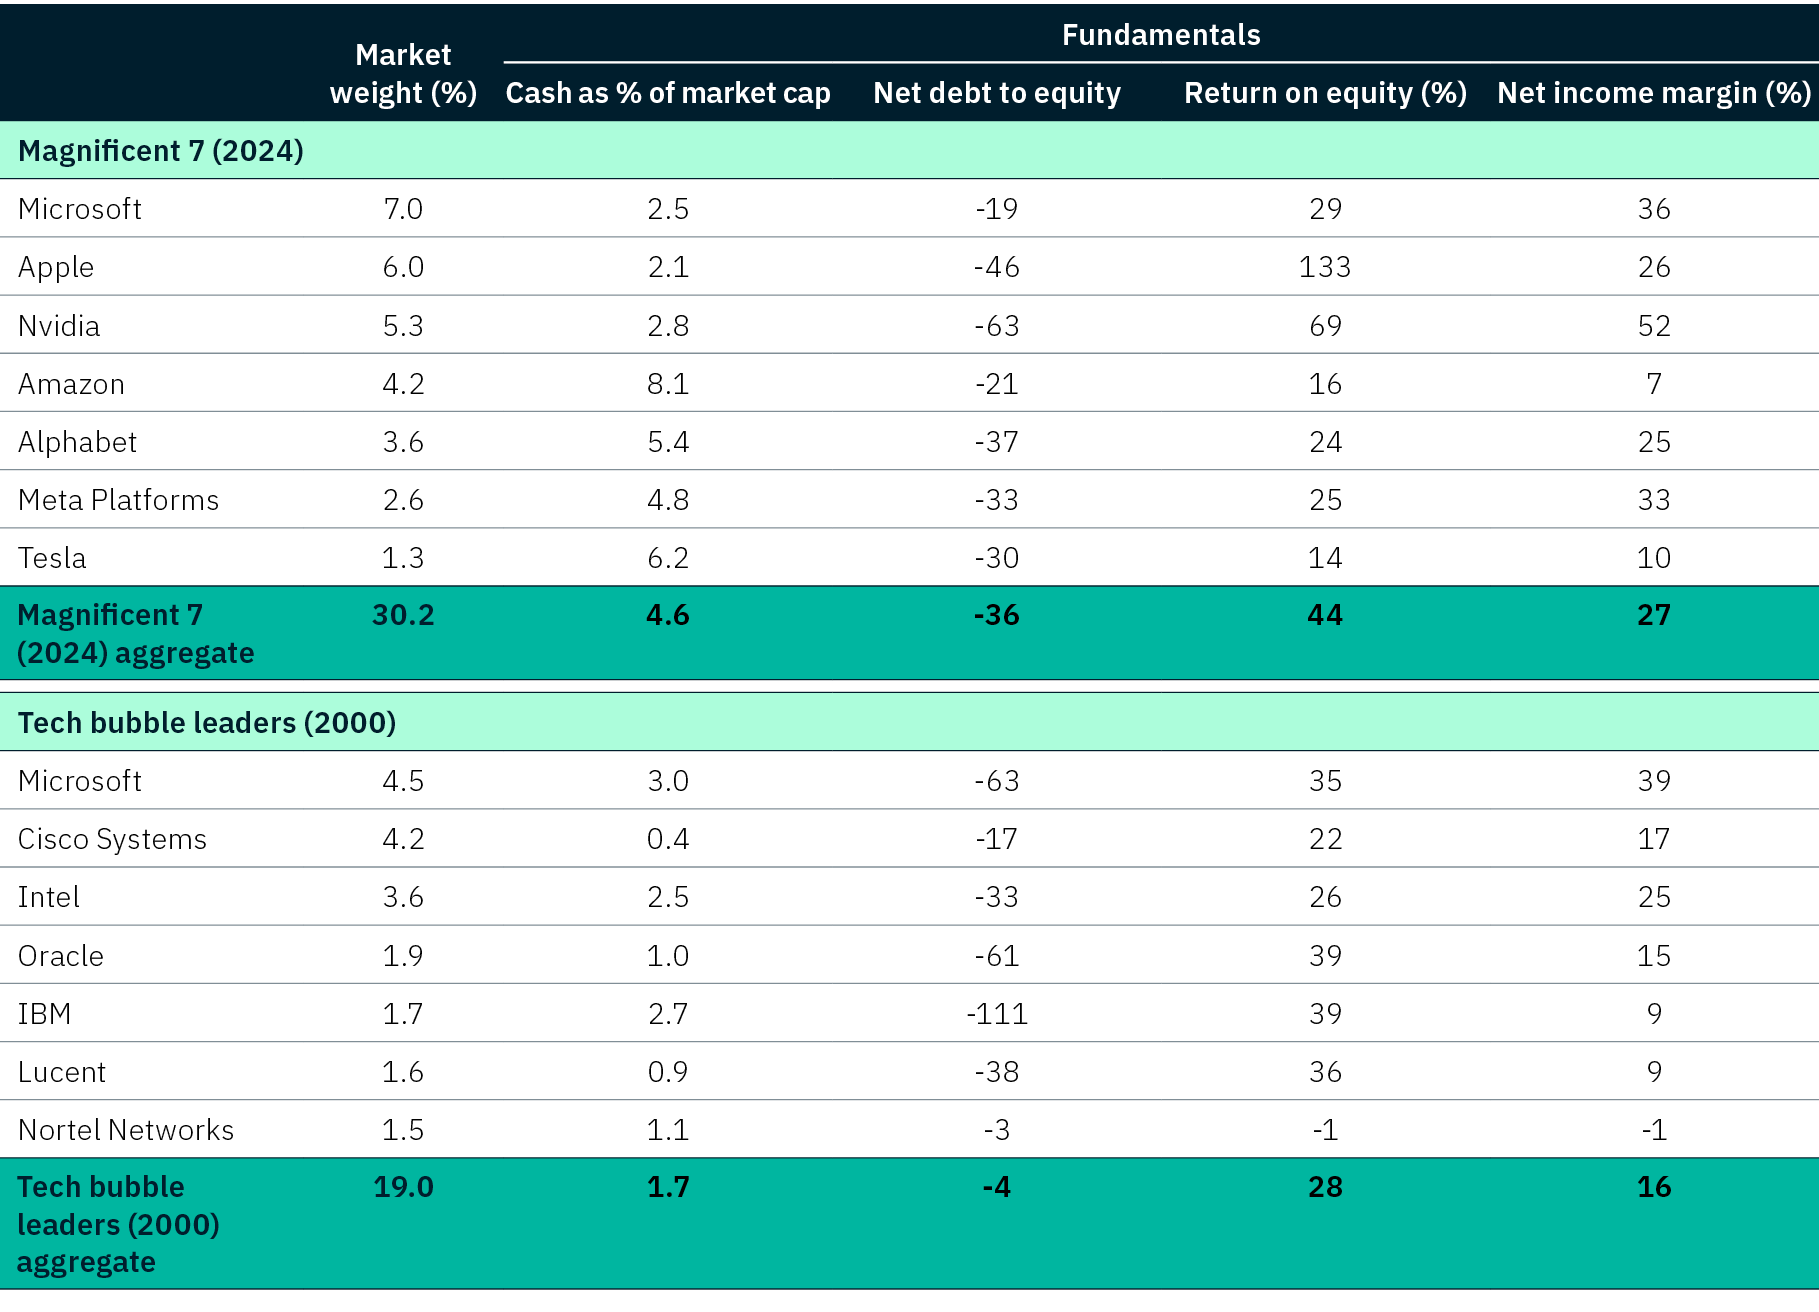
Source: Datastream, FactSet, Goldman Sachs Global Investment Research
Certainly, there are structural tailwinds behind the performance of these market leaders – namely AI, digitisation, healthcare, demographic changes, climate change et al. However, we believe there are some other more cyclical factors which may ultimately run out of pace – the era of ultra-low interest rates is over with firms now facing a higher cost of capital, slowing global growth, the rise of onshoring or nationalisation of supply chains and an inflation backdrop that could potentially be higher for longer.
Any market cycle always sees the emergence of new dominant industries and businesses. Can we expect to see exponential earnings growth from Nvidia for the next five years? Will the rising threat of anti-trust regulation ultimately lead to a break-up of the likes of Alphabet / Google or Apple? Previous market dominance unravelling has always been hard to envisage or predict when you are in the midst of it, but history has told us that this does occur over time.
Of the current top 50 companies in the US, only half of those were in the top 50 a decade ago. Goldman Sachs conducted performance analysis on how previously dominant companies and their share prices evolve over the course of a market cycle. These businesses mature, growth rates stabilise, profits slow and they become lower compounders – perhaps becoming more ‘defensive’ than ‘growth’. New emerging companies and industries arrive and disrupt the business landscape. While the previously dominant companies still enjoy solid absolute returns, they do diminish over time and likewise, the relative performance vs the index also deteriorates.
Chart 8 & 9.
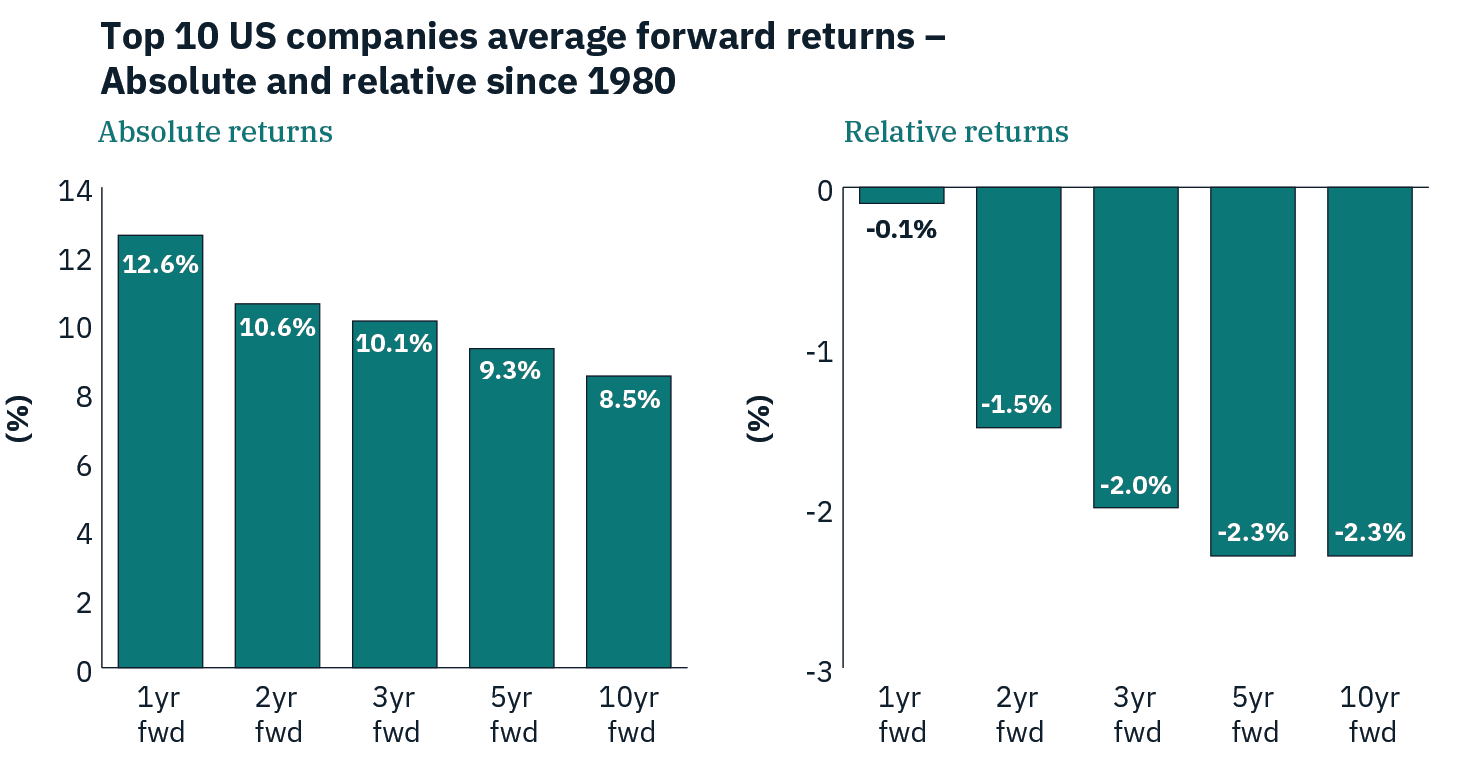
Source: Datastream, Goldman Sachs Global Investment Research
What do we do with all this information?
This is all nice to see and look at, but what do we do with all this information?
Ultimately, it comes down to an awareness of the underlying positioning of your portfolios and its appropriateness for your objectives.
Concentration itself is not necessarily a bad thing in portfolios – an often-quoted remark from Warren Buffett is “Diversification may preserve wealth, but concentration builds wealth”.
However, for Warren this is also easy to say from a position of financial security, when you have tens of billions of dollars of cash at your disposal and a large amount of time to analyse individual investment opportunities. Clearly not all investors have this luxury!
A clearer understanding of the drivers behind each market structure of an index or asset class is essential to build and maintain a portfolio that can meet and hopefully exceed your requirements.
Are you seeking high growth, income generation or defensive stable businesses? Are you entering a market that is in its last stages of a bubble or are we on the cusp of the emergence of a new mega theme? How does the structure today compare to events in the past?
Investors in passive strategies should be increasingly wary of the rising concentration in many markets – lower costs don’t always translate into low volatility.
In the end the key question is what level of return do I need and what risk am I willing to take on to achieve this?
Please reach out to your Pitcher Partners adviser if you wish to understand more about how your portfolio is positioned against these current market dynamics.