
International equities outlook – January 2026
The information in these articles is current as of 1 January 2026.
Overview
International markets continued to climb, up 2.6% and 12.5% for the three months and year to 31 December, respectively. The full-year performance was hindered by a stronger Australian dollar (largely against the US dollar) with the hedged benchmark up 18.6% in 2025, a difference of 6.1%.
MSCI World ex Australia net total return index (Dec-24 to Dec-25)
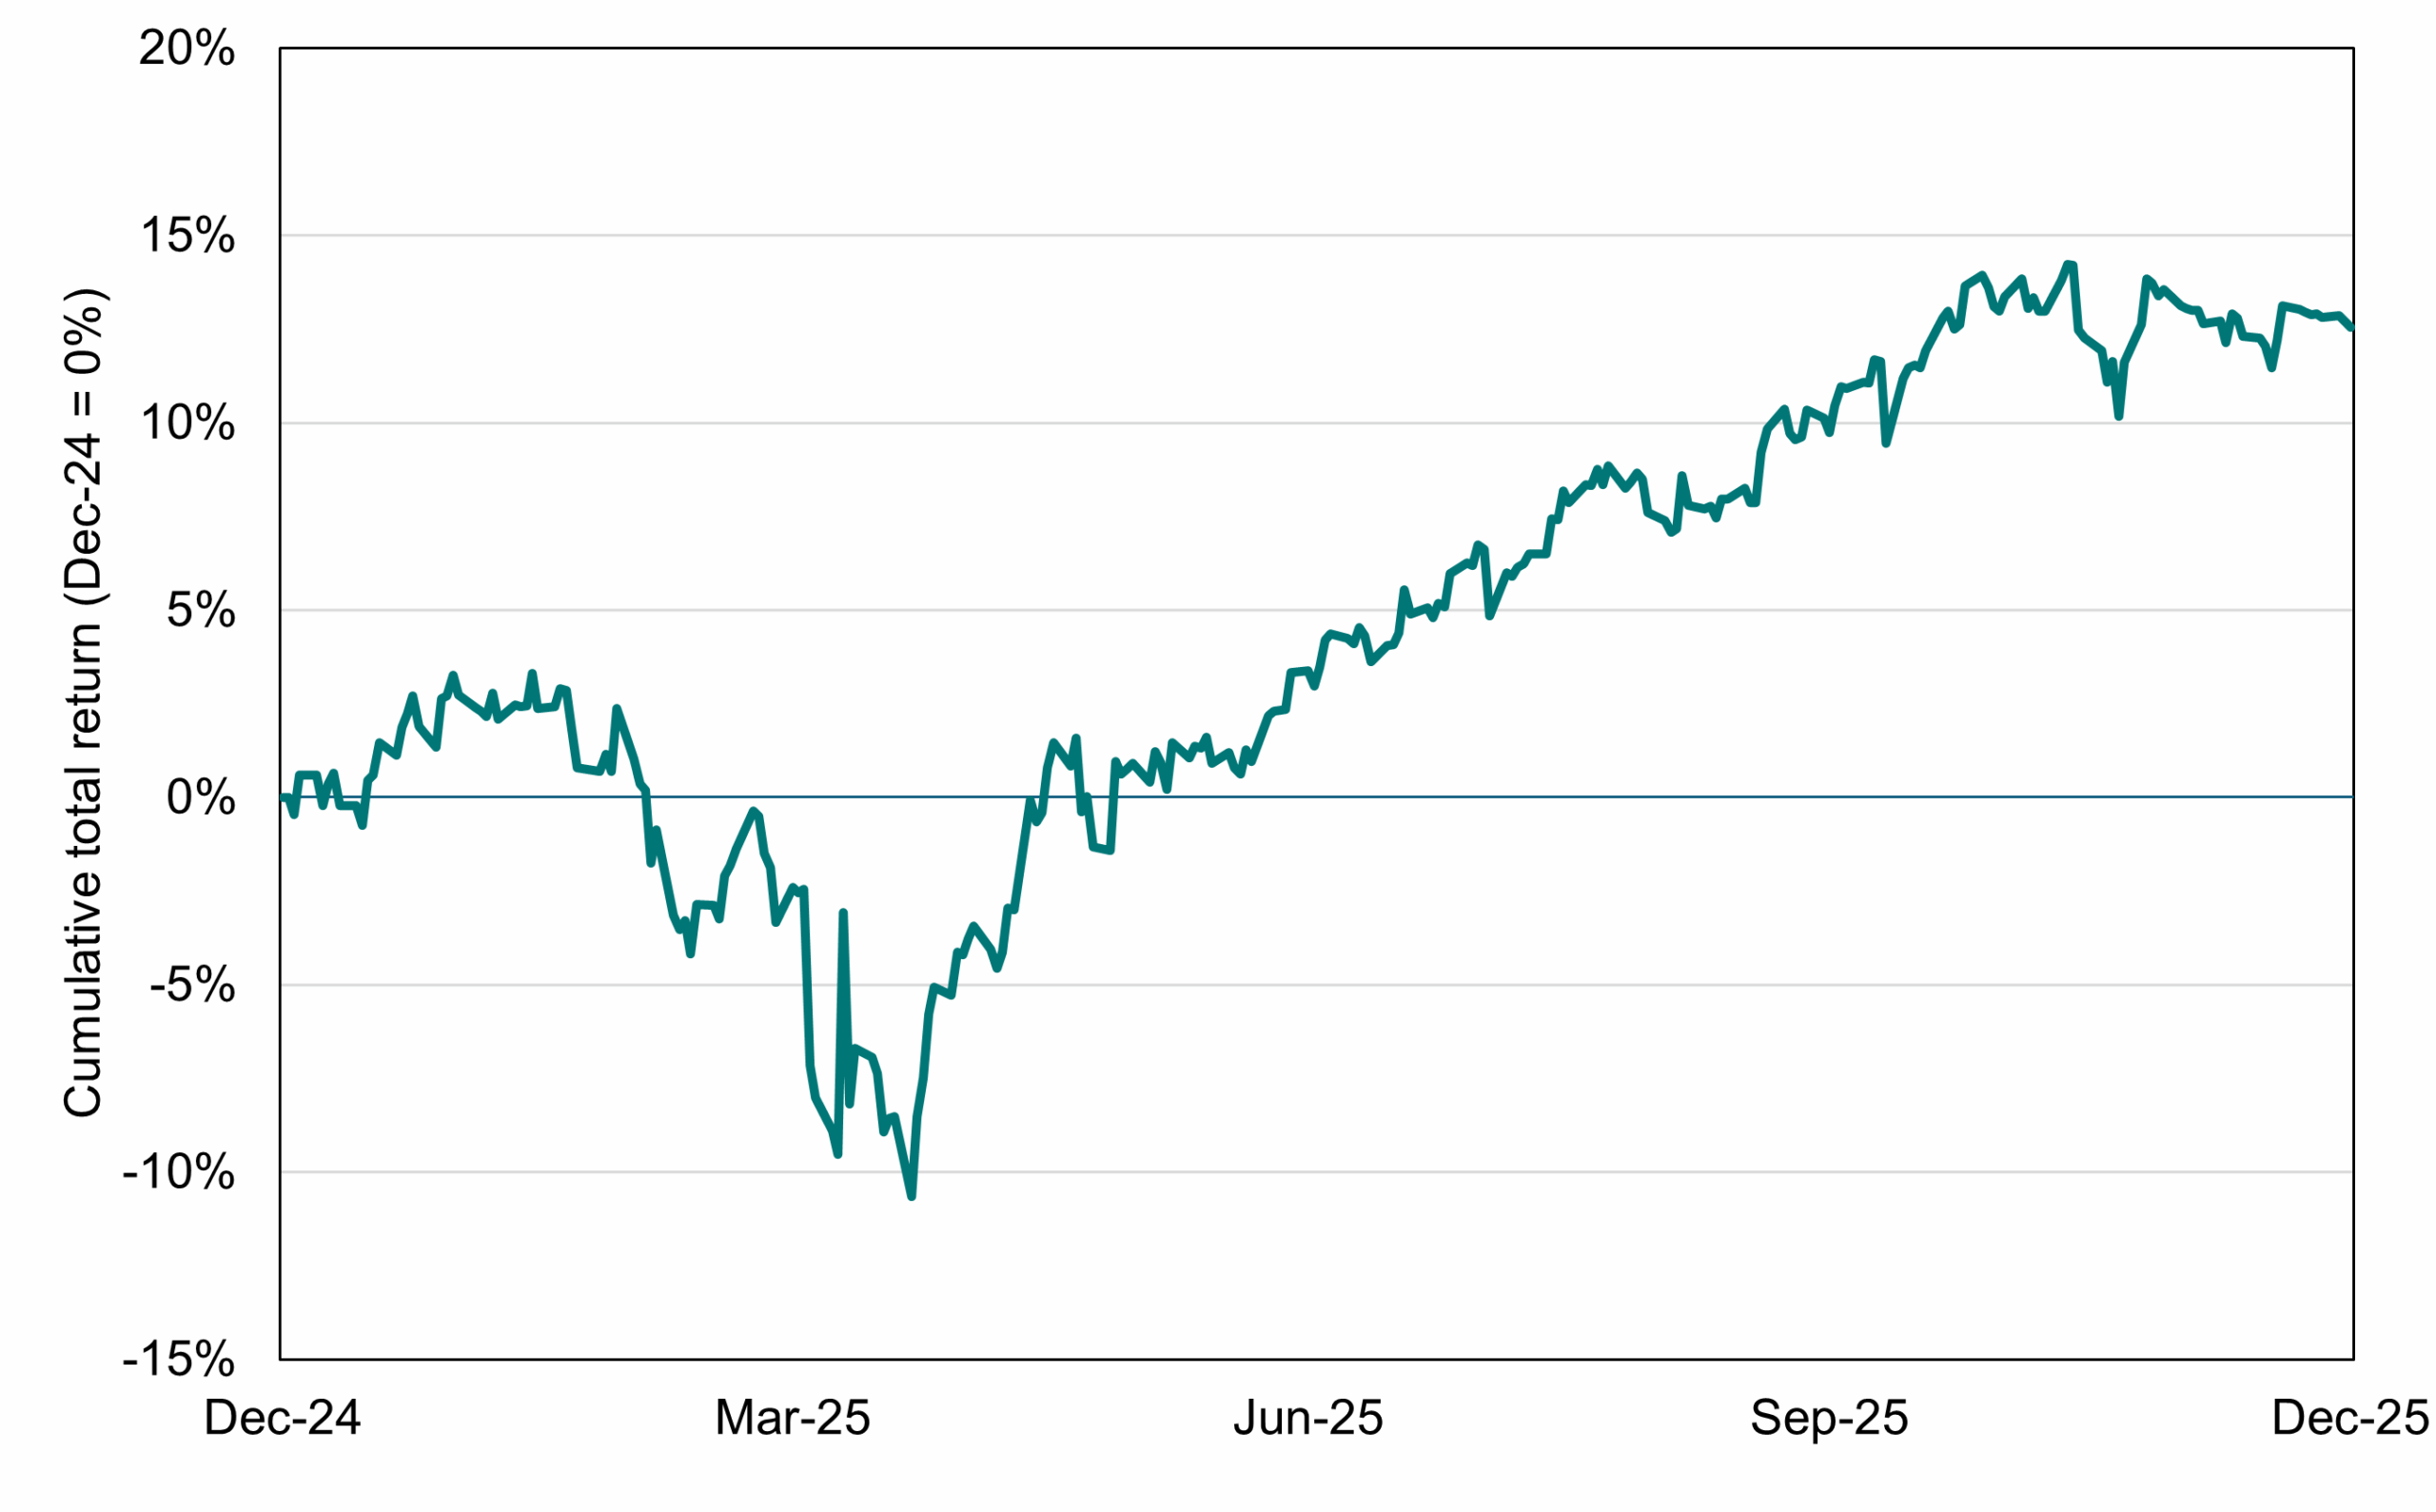
Source: Bloomberg.
Outlook
Global share markets are tangling with several questions at present.
Arguably the biggest question that markets are currently grappling with right now is whether the AI boom is a bubble waiting to burst. The answer to this question is that we do not truly know. We can only speculate on the productivity and efficiency gains that AI may produce in future years. What we do know is that AI infrastructure spending continues at pace, including investments in power generation, data centres, chips and more. Major technology companies, chiefly Microsoft, Alphabet, Amazon and Meta have continued to guide to increased spending in 2026. Bloomberg intelligence estimates a 24.5% increase from these companies alone, rising from US$330.7bn to US$441.6bn. These are some of the most successful companies in history and are heavily incentivised by profit. If they did not think they would generate a return on investment, then it is unlikely they would allocate so much capital. These companies remain strongly profitable and are able to fund these efforts through the use of their own cashflows or by raising debt. Moreover, the return on invested capital (ROIC) for these major tech businesses investing in the AI rollout has continued to remain resilient even with the increased capital spending efforts. Whilst there have been signs of deceleration in select names, it is too immaterial to impact capital spending decisions in our view. Accordingly, we expect AI spending to continue along with its ensuing spillover effects to the benefit of industries such as utilities, semiconductors, cooling technology and more. In the meantime, bubble or no bubble, this will continue to provide a material support to overall growth in the US.
Return on invested capital for tech majors (Sep-15 to Sep-25)
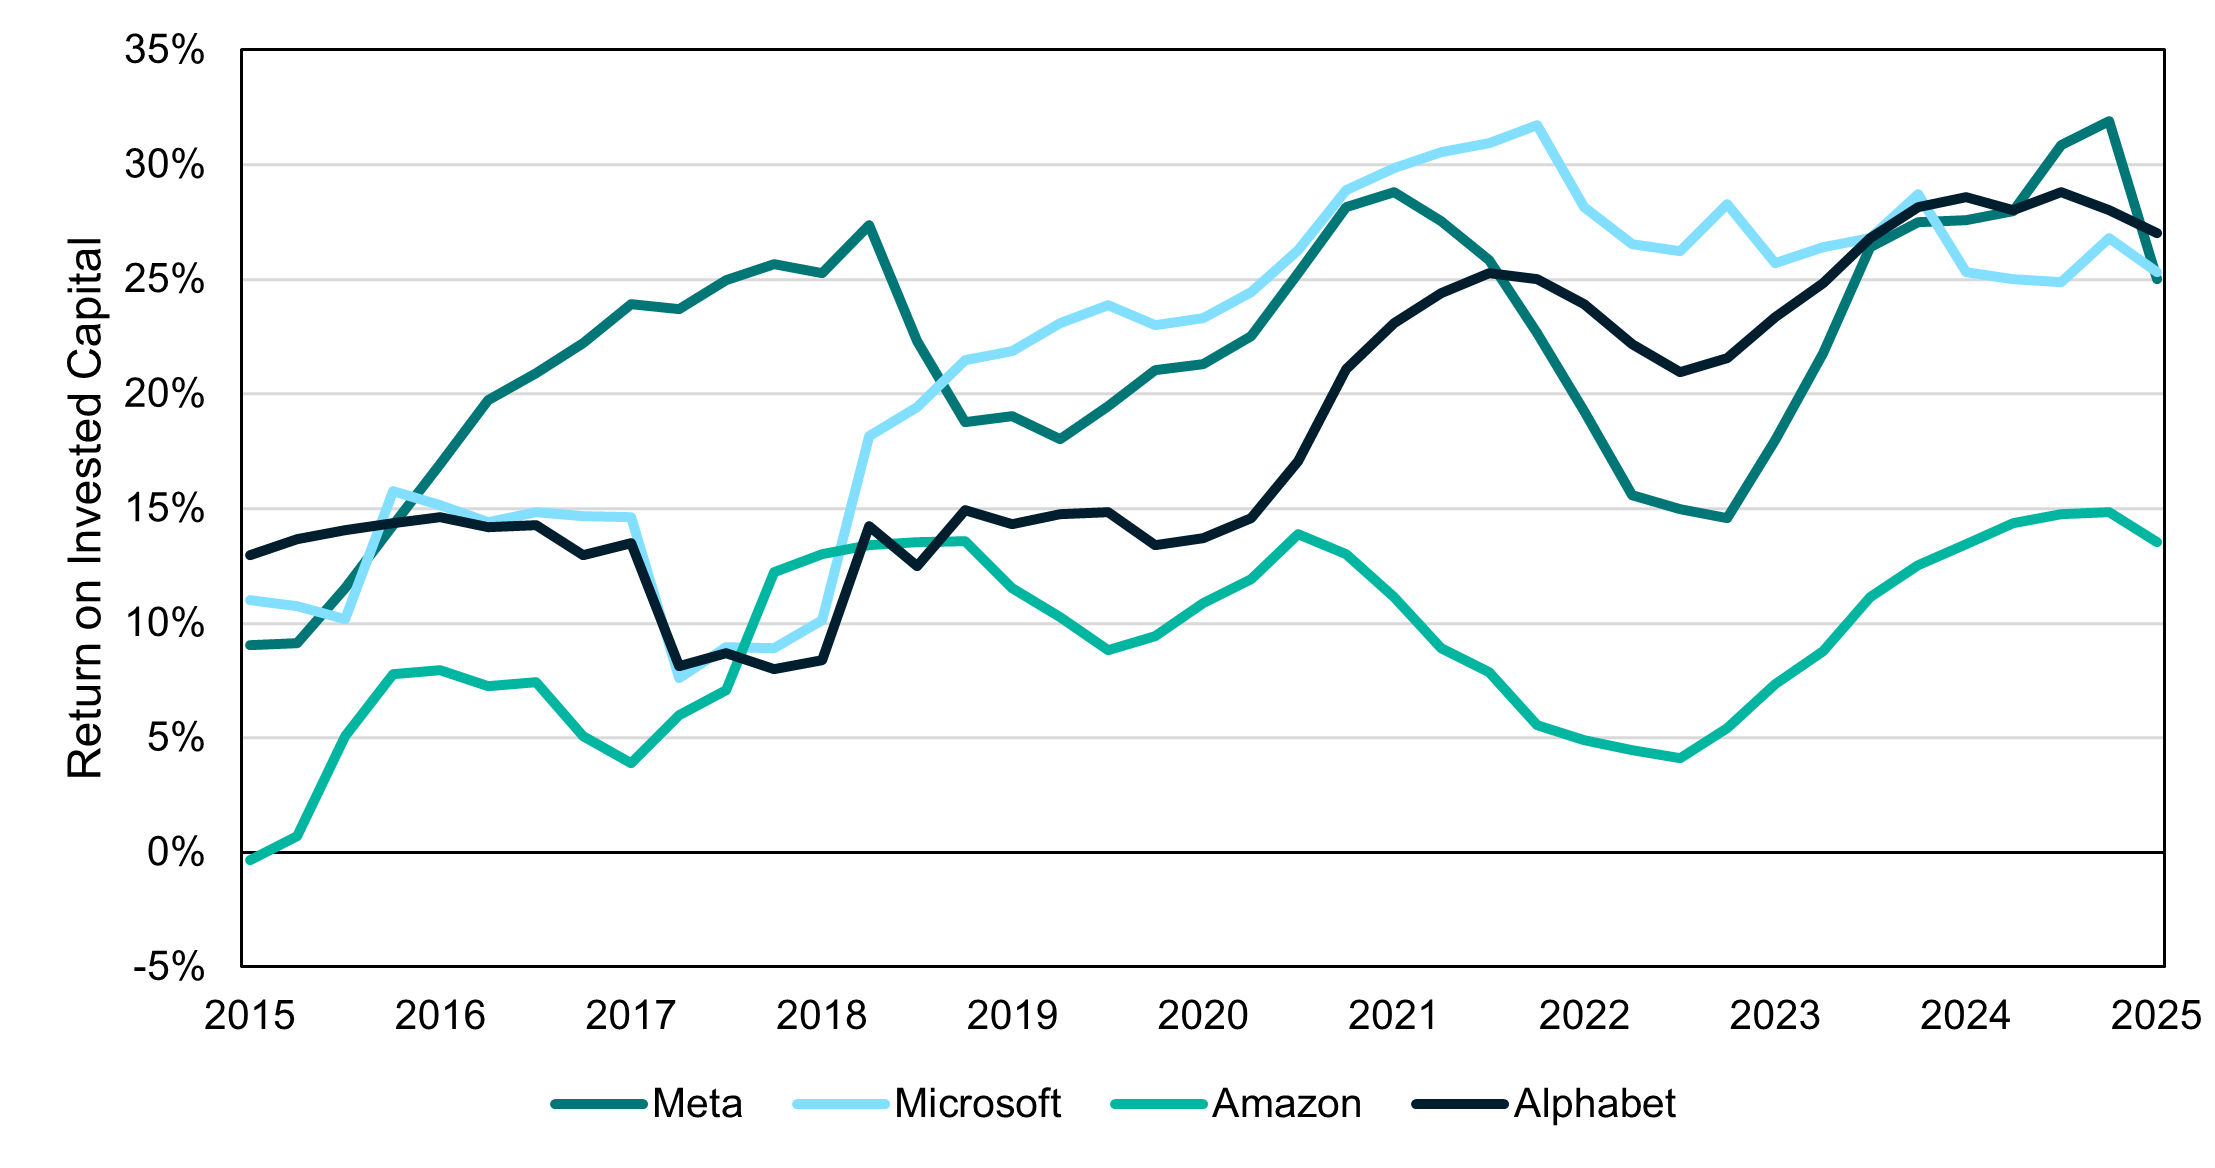
Source: Bloomberg
Another question of open debate revolves around who is likely to be the “AI winners” and “AI losers”. These are the companies that stand to either gain or lose the most from the growth in AI solution adoption. 2025 has been marked by shifts in what is perceived as the key leading AI model at any given time. Alphabet for example gained 26% in the December quarter alone following promising developments for its Gemini model whilst Microsoft, the public company most prominently associated with OpenAI’s ChatGPT model, declined 6% over the same period.
We believe it is important to take a broad approach towards investing in AI innovation and clearly AI model leadership can change quickly. The size of potential markets for AI is significant and could conceivably lead to a similar outcome as the migration from on-premises data storage to the cloud. In that case many private sector businesses and governments decided against building servers and data centres and instead leased these offerings from cloud providers such as Amazon. The secular tailwind from market growth allowed for multiple winners including relative latecomer Alphabet. The transition to AI solutions is unlikely to result in a single “winner” per se with capacity for many businesses to benefit.
The final question subject to much debate is whether the era of US exceptionalism is nearing its zenith. This refers to the ongoing outperformance of American share markets relative to the rest of the world since 2009 and whether it will be maintained. In our view the US has seen structural change in its sharemarket with marked improvement in quality over recent decades. On a prospective basis this quality is expected to be maintained with stronger earnings growth and higher returns on capital than global markets outside the US. A policy mistake could risk this dynamic but, at present, the policy changes under the Trump Administration have not led to marked deterioration in US business performance.
If we shift to factors outside AI and the US, we can see that policy support is intact. Major central banks have, Japan excepted, maintained an easing bias. This is expected to widen even further if the US Fed cuts as consensus suggests. Policymakers are also maintaining stimulative fiscal policy which should underpin household demand going forward. The one sticking point, however, lies in the expensive valuations relative to history.
Regional Forward Price-Earnings ratios versus long-term averages as at 31 December 2025
| Region | Forward P/E ratio | 15-year Average Forward P/E ratio | Potential upside/downside |
| USA | 22.0x | 16.6x | -24.4% |
| All Country World (ex-US) | 15.0x | 12.8x | -14.9% |
| Australia | 18.3x | 15.1x | -17.7% |
| Europe | 15.1x | 13.3x | -12.1% |
| Emerging markets | 13.2x | 11.0x | -16.5% |
| Japan | 16.8x | 14.0x | -16.7% |
| UK | 13.4x | 12.1x | -9.6% |
| China | 12.1x | 10.4x | -14.1% |
Source: Bloomberg
Valuations, in our view, are not at a sufficient extreme to warrant pessimism. This is so, especially when one considers the structural improvement in markets such as the US. Japan has also “found religion” in the form of pro-shareholder policies that justify the improved valuation as corporate governance has improved markedly in recent years.
Conclusion
Recommendation: Remain neutral.
Although market valuations remain elevated by historical standards, earnings growth expectations remain strong by the once in a generation technological AI revolution underway. Policy settings too remain broadly supportive of growth. The tailwinds of strong business investment spending coupled with policymaker stimulus at both a government and central bank level should prevail. Tail risks can still arise as the Liberation Day announcement by President Trump showed. On balance we believe a neutral exposure to international equities remains warranted.