
Australia’s economic outlook: market insights for January 2026
The information in these articles is current as of 1 January 2026.
Part 1: Overview
Until recently, the Australian economy had been challenged by pandemic induced inflationary pressures and high interest rates that had eroded household disposable incomes and crimped consumption. Indeed, up until the end of March, GDP per capita had been negative for 9 quarters in 11. Over that period the Australian economy only managed to avoid a recession by a combination of elevated government spending measures and an influx of new migrants. Fortunately, in response to this rather grim situation and a softening in goods inflation, the RBA began to cut rates in February. Since then, rates have been fallen from a peak of 4.35% to the current setting of 3.6%. These cuts, coupled with growth in real wages, have provided much needed relief to heavily indebted households and have translated, into a moderate improvement in consumer and business confidence.
On the growth front, we appear to be nearing the much-anticipated handover from an economy led by the public-sector to one driven instead by household and business spending. In fact, non-mining business investment is on track to reach record levels by 2026/27. This reflects a surge in spending on information technology, software, and data infrastructure. Construction of data centres is booming to support the exploding demand for cloud services. Likewise, the renewable energy industry is entering a critical build-out phase. To meet 2030 emissions targets, Australia needs to install 6–7 GW of renewable capacity annually. As a result, the pipeline of renewable projects is very large (~$170 billion), supported by government initiatives and private capital, which should benefit engineering, manufacturing, and regional job markets. In combination, these investments should also provide a much-needed boost to Australia’s abysmal productivity record in recent years. Meanwhile robust wage growth coupled with a tight labour market are expected to underpin household consumption. These factors should see growth pick up modestly back towards trend-levels after more challenging conditions earlier in the year due to Cyclone Alfred amongst other headwinds.
Employment & wages
After reaching 50-year lows of around 3.5% in 2022, the jobless rate has drifted slightly higher over the last few years. The latest print of 4.3% in November is still well-below pre-pandemic averages as is the underemployment rate at 6.2% vs the mid-8s seen pre-pandemic. NDIS and broader healthcare-related spending (refer chart below) is a key driver of this phenomenon with participation rates lifting nationally by 1.1% since February 2020 with most of this coming through new roles for female workers whose participation rate has risen 1.9% over this period versus a more modest 0.2% gain for male workers. Demand for labour is softening at the margins; job vacancies have come down from peak levels but hiring continues in many sectors and the participation rate remains near record highs (~67%). The most recent Treasury forecasts suggest that unemployment will edge up to around 4.5% by the end of 2026. Employment growth is forecast to be positive but slower, about 1.25% in 2025/26 and 1.5% in 2026/27.
Average annual growth in major payments from 2025–26 to 2035–36
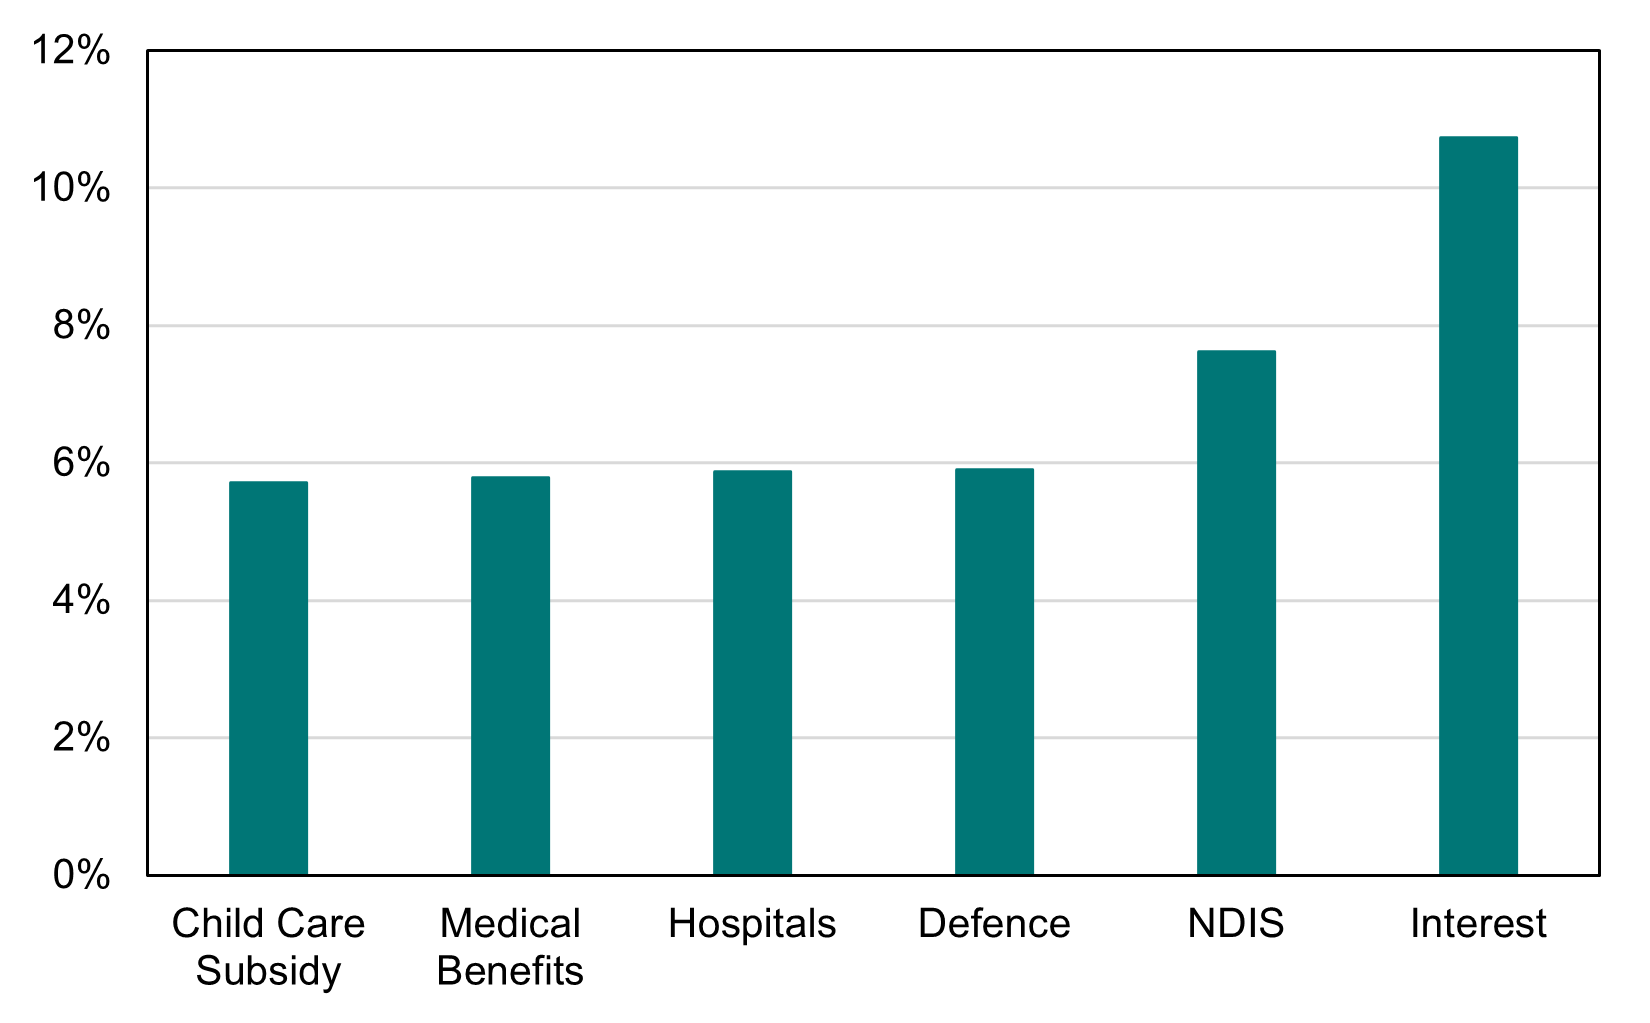
Source: MYEFO 2025-2026
Inflation
The downside of a tighter labour market and elevated government spending has been higher inflation. As the breakdown below shows, headline inflation is being driven by elevated, government-set prices (including childcare, aged care and NDIS) as well as stronger costs for market services. The latter category is largely determined by wage growth and highlights the challenge facing Australia. Lower inflation would require material productivity gains in the services sector i.e. doing more with less. Historically this has been very difficult to achieve with services jobs less susceptible to improvement by factors such as new investment. Another consideration could be reduced government-set inflation, but this is often politically untenable. These higher prices are often set at the behest of particular interest groups e.g. funding for aged care services and are not easily tractable to cuts.
Australian inflation drivers (Sep-15 to Oct-25)
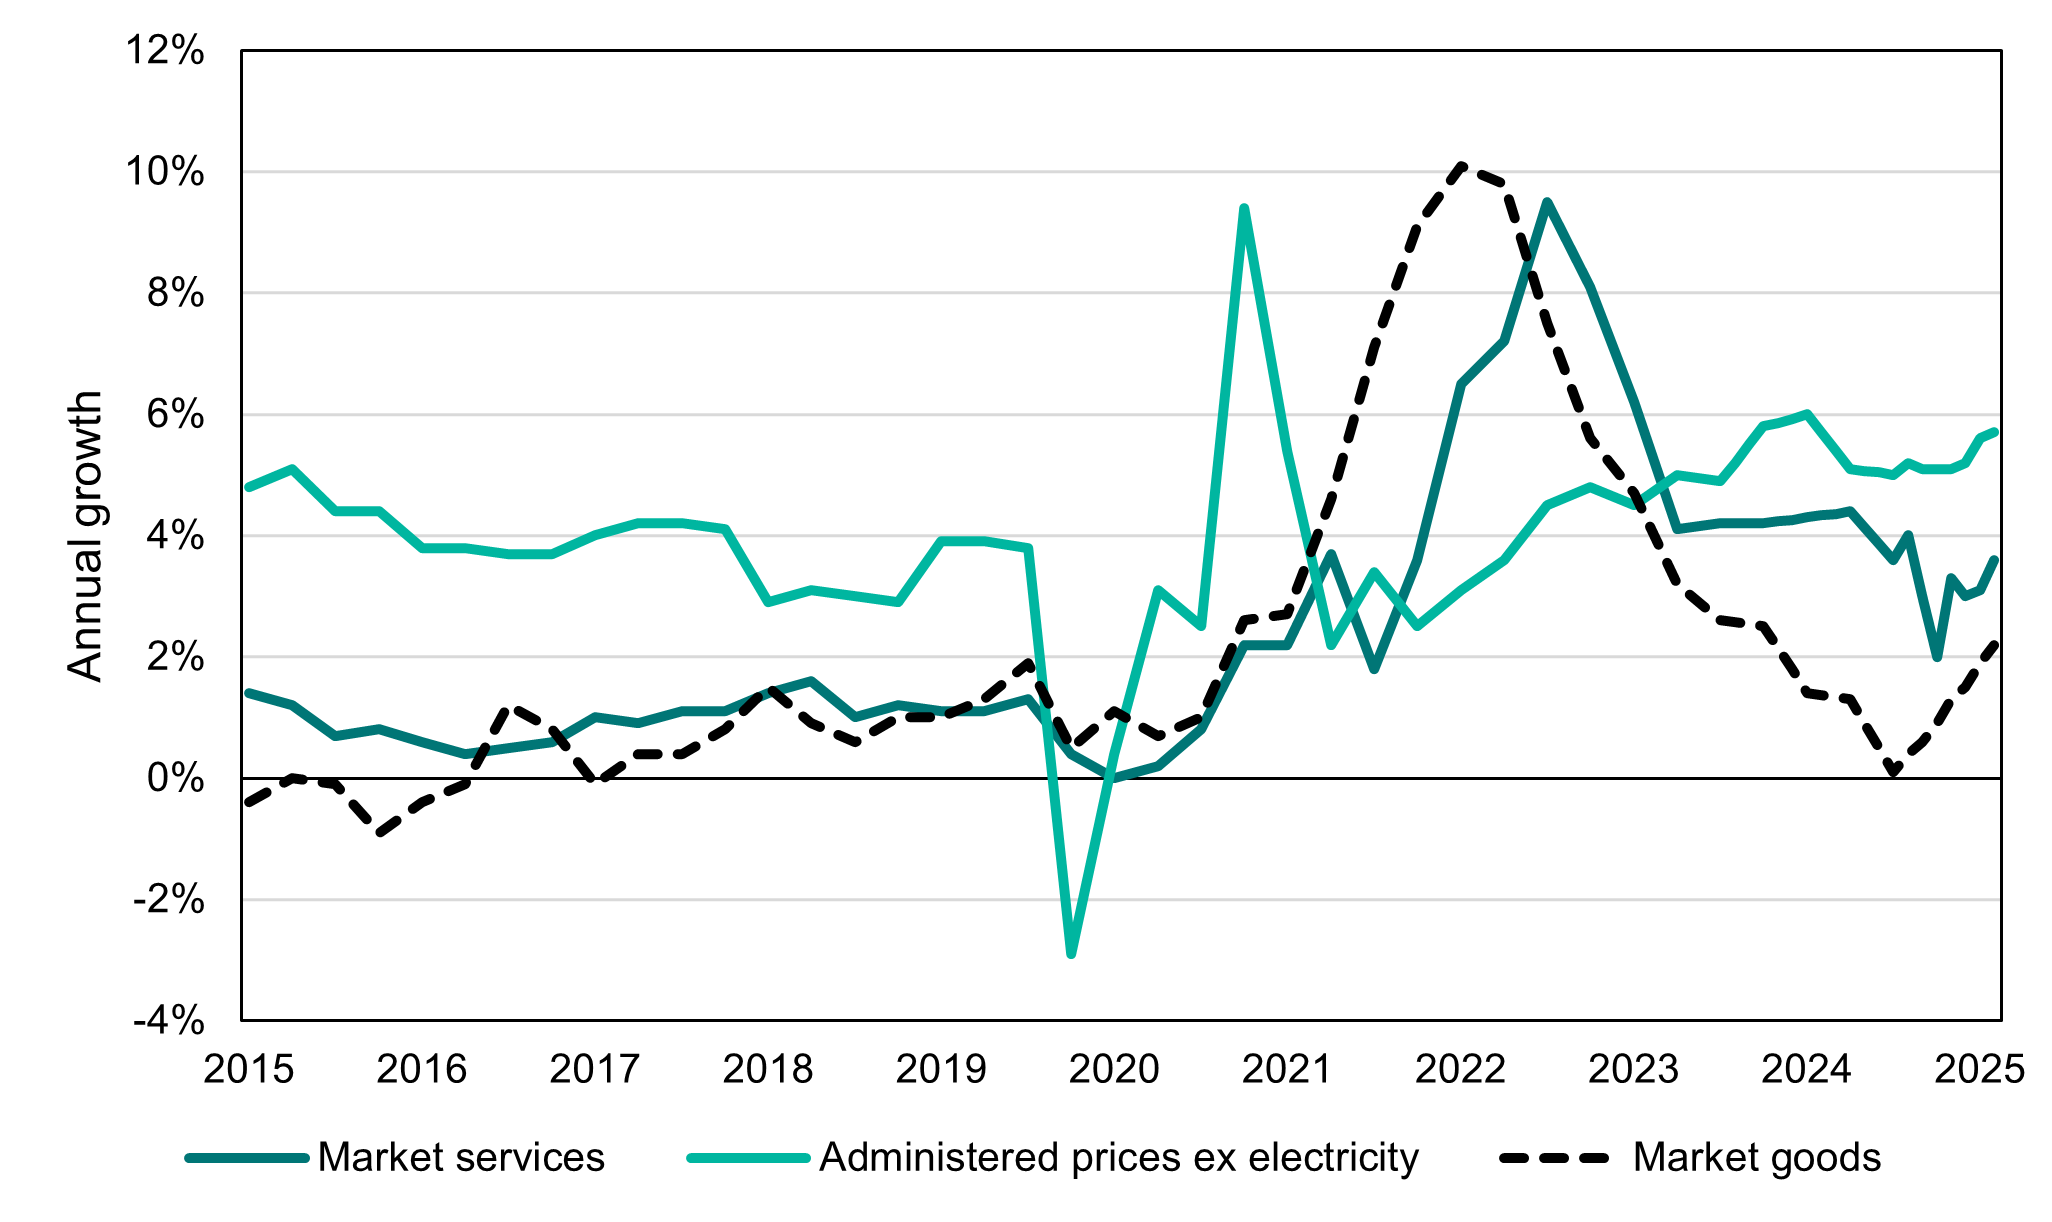
Source: MYEFO 2025-2026, ABS and Treasury estimates; PPSPW interpolation for zero values.
Headline consumer price inflation, which was running at 3.8% as of late 2025, is forecast to fall gradually to 3.75% by June. Inflation is then expected to moderate to 2.75% in 2026/27. Underlying inflation (core inflation) currently running at 3.3%, is likewise expected to fall to 2.5% on an annual basis as the effects of temporary price shocks (like energy rebates ending) fade. The easing price pressures reflect several factors: global goods disinflation, improved supply chains, and the dampening effect of higher interest rates on demand. Services inflation, however, remains somewhat stickier. Rising wages and strong demand for some services mean it will decline more gradually.
Interest rates
With underlying inflation outside the RBA’s target range, it is no surprise that market economists have adjusted their interest rate expectations in recent weeks. NAB now expects rates to rise by 0.25% in February and then May, whilst CBA expect one 0.25% rate rise in February. Futures markets now predict a high probability that the cash rate will be 3.85% by June and remain there for the rest of the calendar year. We think the RBA will be gradual in its decision to resume hikes if it chooses to proceed. This would be consistent with their recent decisions to hike in 2022 before beginning to ease policy subsequently. It will also be data-dependent in our view. If inflation prints remain entrenched outside their target band of 2–3% we would expect hikes are an increasingly likely prospect. The other part of the RBA mandate is full employment and given how tight our labour market remains we do not anticipate this being a factor in their decision making in the near term. In summary this suggests that potentially one hike or more may occur in 2026 if the RBA feels it has made insufficient progress in taming inflation.
The question of whether the RBA will succeed even if it does hike rates, poses an interesting conundrum. Arguably inflation’s easing from 2022 had less to do with rate hikes and more the easing of supply chain pressures brought on by the pandemic. This is consistent with the global disinflation experienced in recent years despite vastly differing interest rate settings. The fact that the government is committed to keeping the labour markets tight in the near term may limit the efficacy of RBA hikes as government spending is less sensitive to interest rate costs than the private sector. The RBA views itself as a public institution that needs to be seen to be acting even if its actions are being negated. This line of thinking would suggest hikes will still occur even if their net impact on overall inflation will be muted.
Australian cash rate market-implied expectations (31 December vs 30 September)
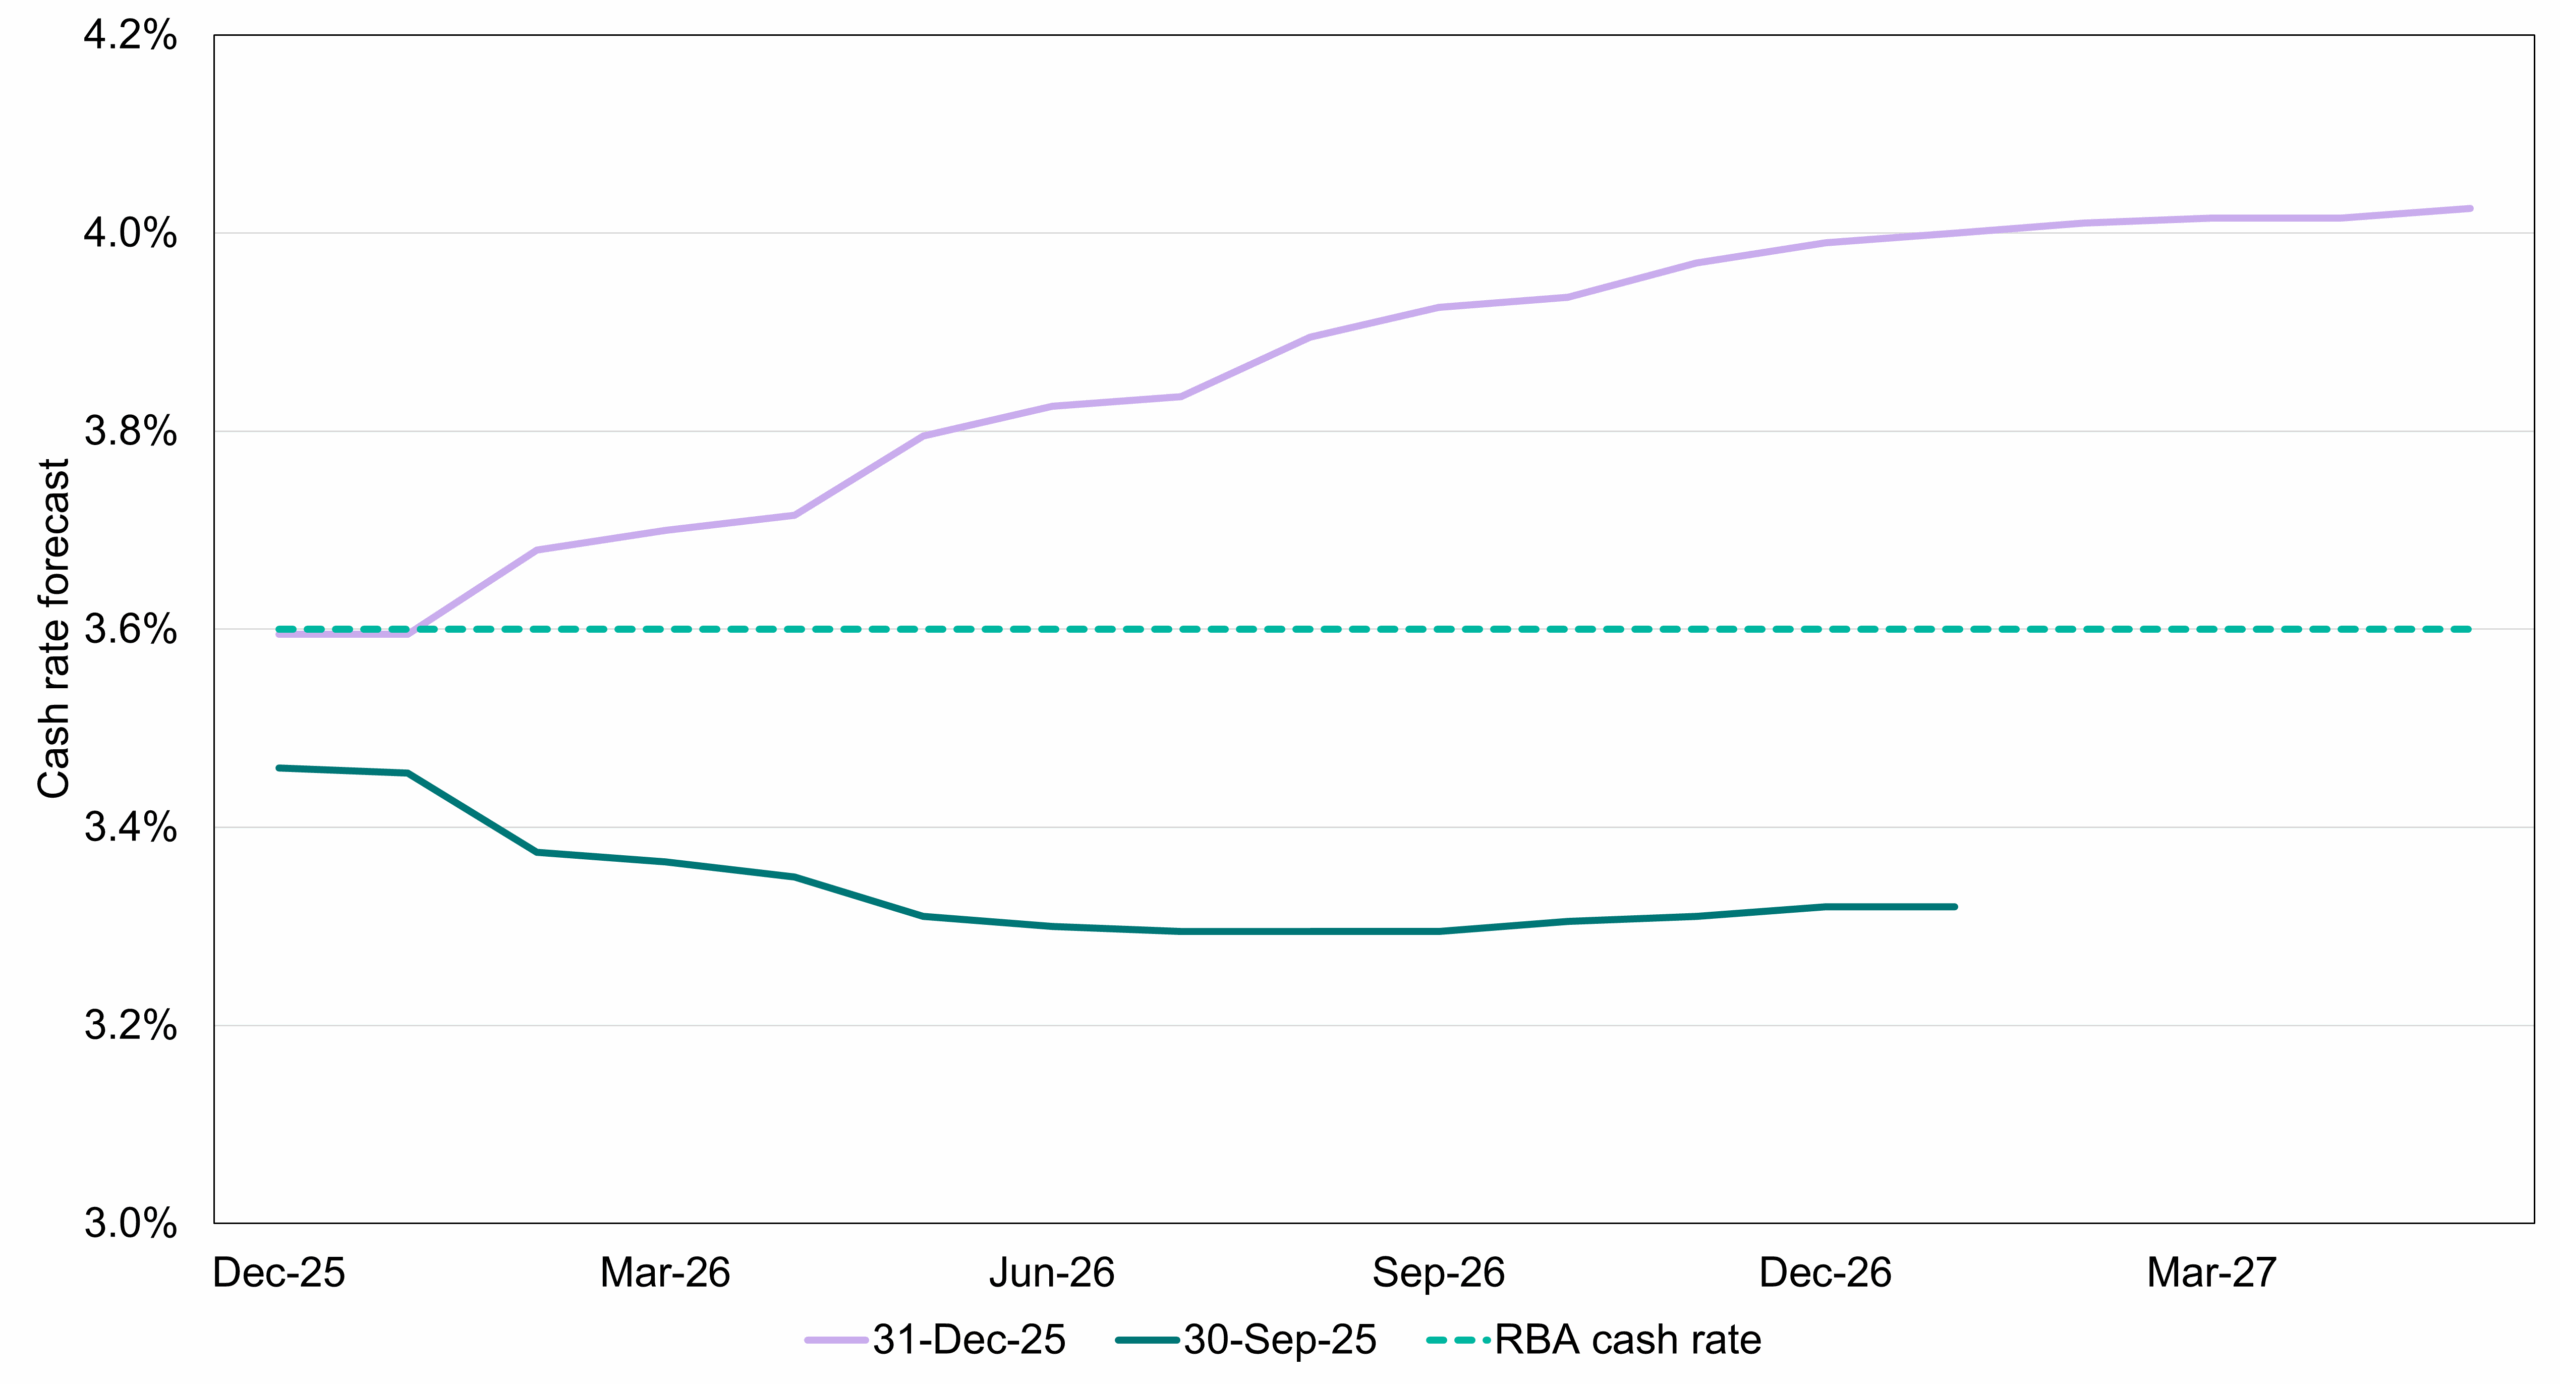
Source: Bloomberg, ASX, PPSPW calculations
Housing
After rebounding in 2025, national home prices are forecast to rise further in 2026, in the order of 6–8%, with some capital cities (Brisbane, Perth) potentially seeing double digit gains. Australia’s chronic housing undersupply, coupled with strong population growth (via migration), is keeping upward pressure on house prices. Improved consumer confidence and government incentives for first-home buyers are providing additional support. Housing construction is also set to pick up in 2026. Building approvals and housing starts have started rising again, which will translate into higher construction activity over the next 18 months. Large state programs for social housing and federal support for affordable housing (like the Housing Australia Future Fund) remain tailwinds. Treasury forecasts growth of 5.5% in 2025/26 and 6% in 2026/27. Easing supply constraints (materials costs have come down from 2022 peaks, and labour availability has improved) are enabling more home-building. That said, new supply will still likely fall short of surging demand in the near term, so the rental market remains extremely tight, and affordability challenges persist.
Mining
Australia’s resource sector faces a more subdued outlook in 2026. While production volumes of major commodities (iron ore, coal, LNG, metals) are expected to remain high, commodity prices are projected to soften. Iron ore, Australia’s top export, is forecast to decline to around US$83/tonne by late 2026, down roughly 20% from current levels. This reflects lower fixed asset investment from China (lacklustre construction activity) and increasing global supply (including the new mine in Africa’s Simandou region). Treasury likewise expects declines in coal and gas prices from recent peaks. Export earnings from resources are therefore likely to have peaked. Indeed, Australia’s terms of trade (ratio of export to import prices) are forecast to fall 6% in 2026/27. On the investment side, mining capital expenditure is expected to be flat in 2025/26 and 2026/27. The big miners are focused on capital discipline and shareholder returns rather than major new capacity, especially in coal where the long-term outlook is more constrained.
Conclusion
After years of lacklustre demand, growth is set to accelerate from 1.4% in 2024/25 to 2.25% in 2025/26 and 2026/27, supported by near full employment and a surge in business investment. Ongoing public spending is acting as an important backstop for this growth but also carries the downside of boosting inflationary pressures. There is now a heightened risk of rate hikes but on balance the breadth of economic activity should not derail the pickup in growth.
Part 2: Key economic indicators
| Economic snapshot | Last reported result | Date |
| Growth (GDP) | 2.10% | Sep-25 |
| Inflation | 3.80% | Oct-25 |
| Interest rates | 3.60% | Dec-25 |
| Unemployment rate | 4.3% | Nov-25 |
| Composite PMI | 52.6 | Nov-25 |
| Economic snapshot | 2026e | 2027e |
| Growth (GDP) | 2.2% | 2.3% |
| Inflation | 3.1% | 2.6% |
| Interest rates | 3.5% | 3.6% |
| Unemployment rate | 4.4% | 4.4% |
| US Dollars per 1 Australian Dollar ($) | 0.69 | 0.70 |
Source: Bloomberg