
Australian equities outlook – January 2026
The information in these articles is current as of 1 January 2026.
Overview
The Australian market ended 2026 on a softer note, falling 1% for the three months to 31 December but rising 10.3% for the full year.
Rising valuations continue to be an important factor accounting for almost half the return (share prices have risen at a faster rate than earnings) with dividends the other notable support amid subdued earnings growth. The Materials sector led by miners such as BHP and Rio Tinto has been the clear standout in 2025 with price growth of almost 32% followed by Industrials (up 10.2%) and Financials (up 8%).
This year has been a tough one for growth stalwarts in the Technology sector as well as Health Care where giant CSL’s lagging performance has weighed on returns with both sectors declining over 21% in 2025.
S&P/ASX 200 Total return index (Dec-24 to Dec-25)
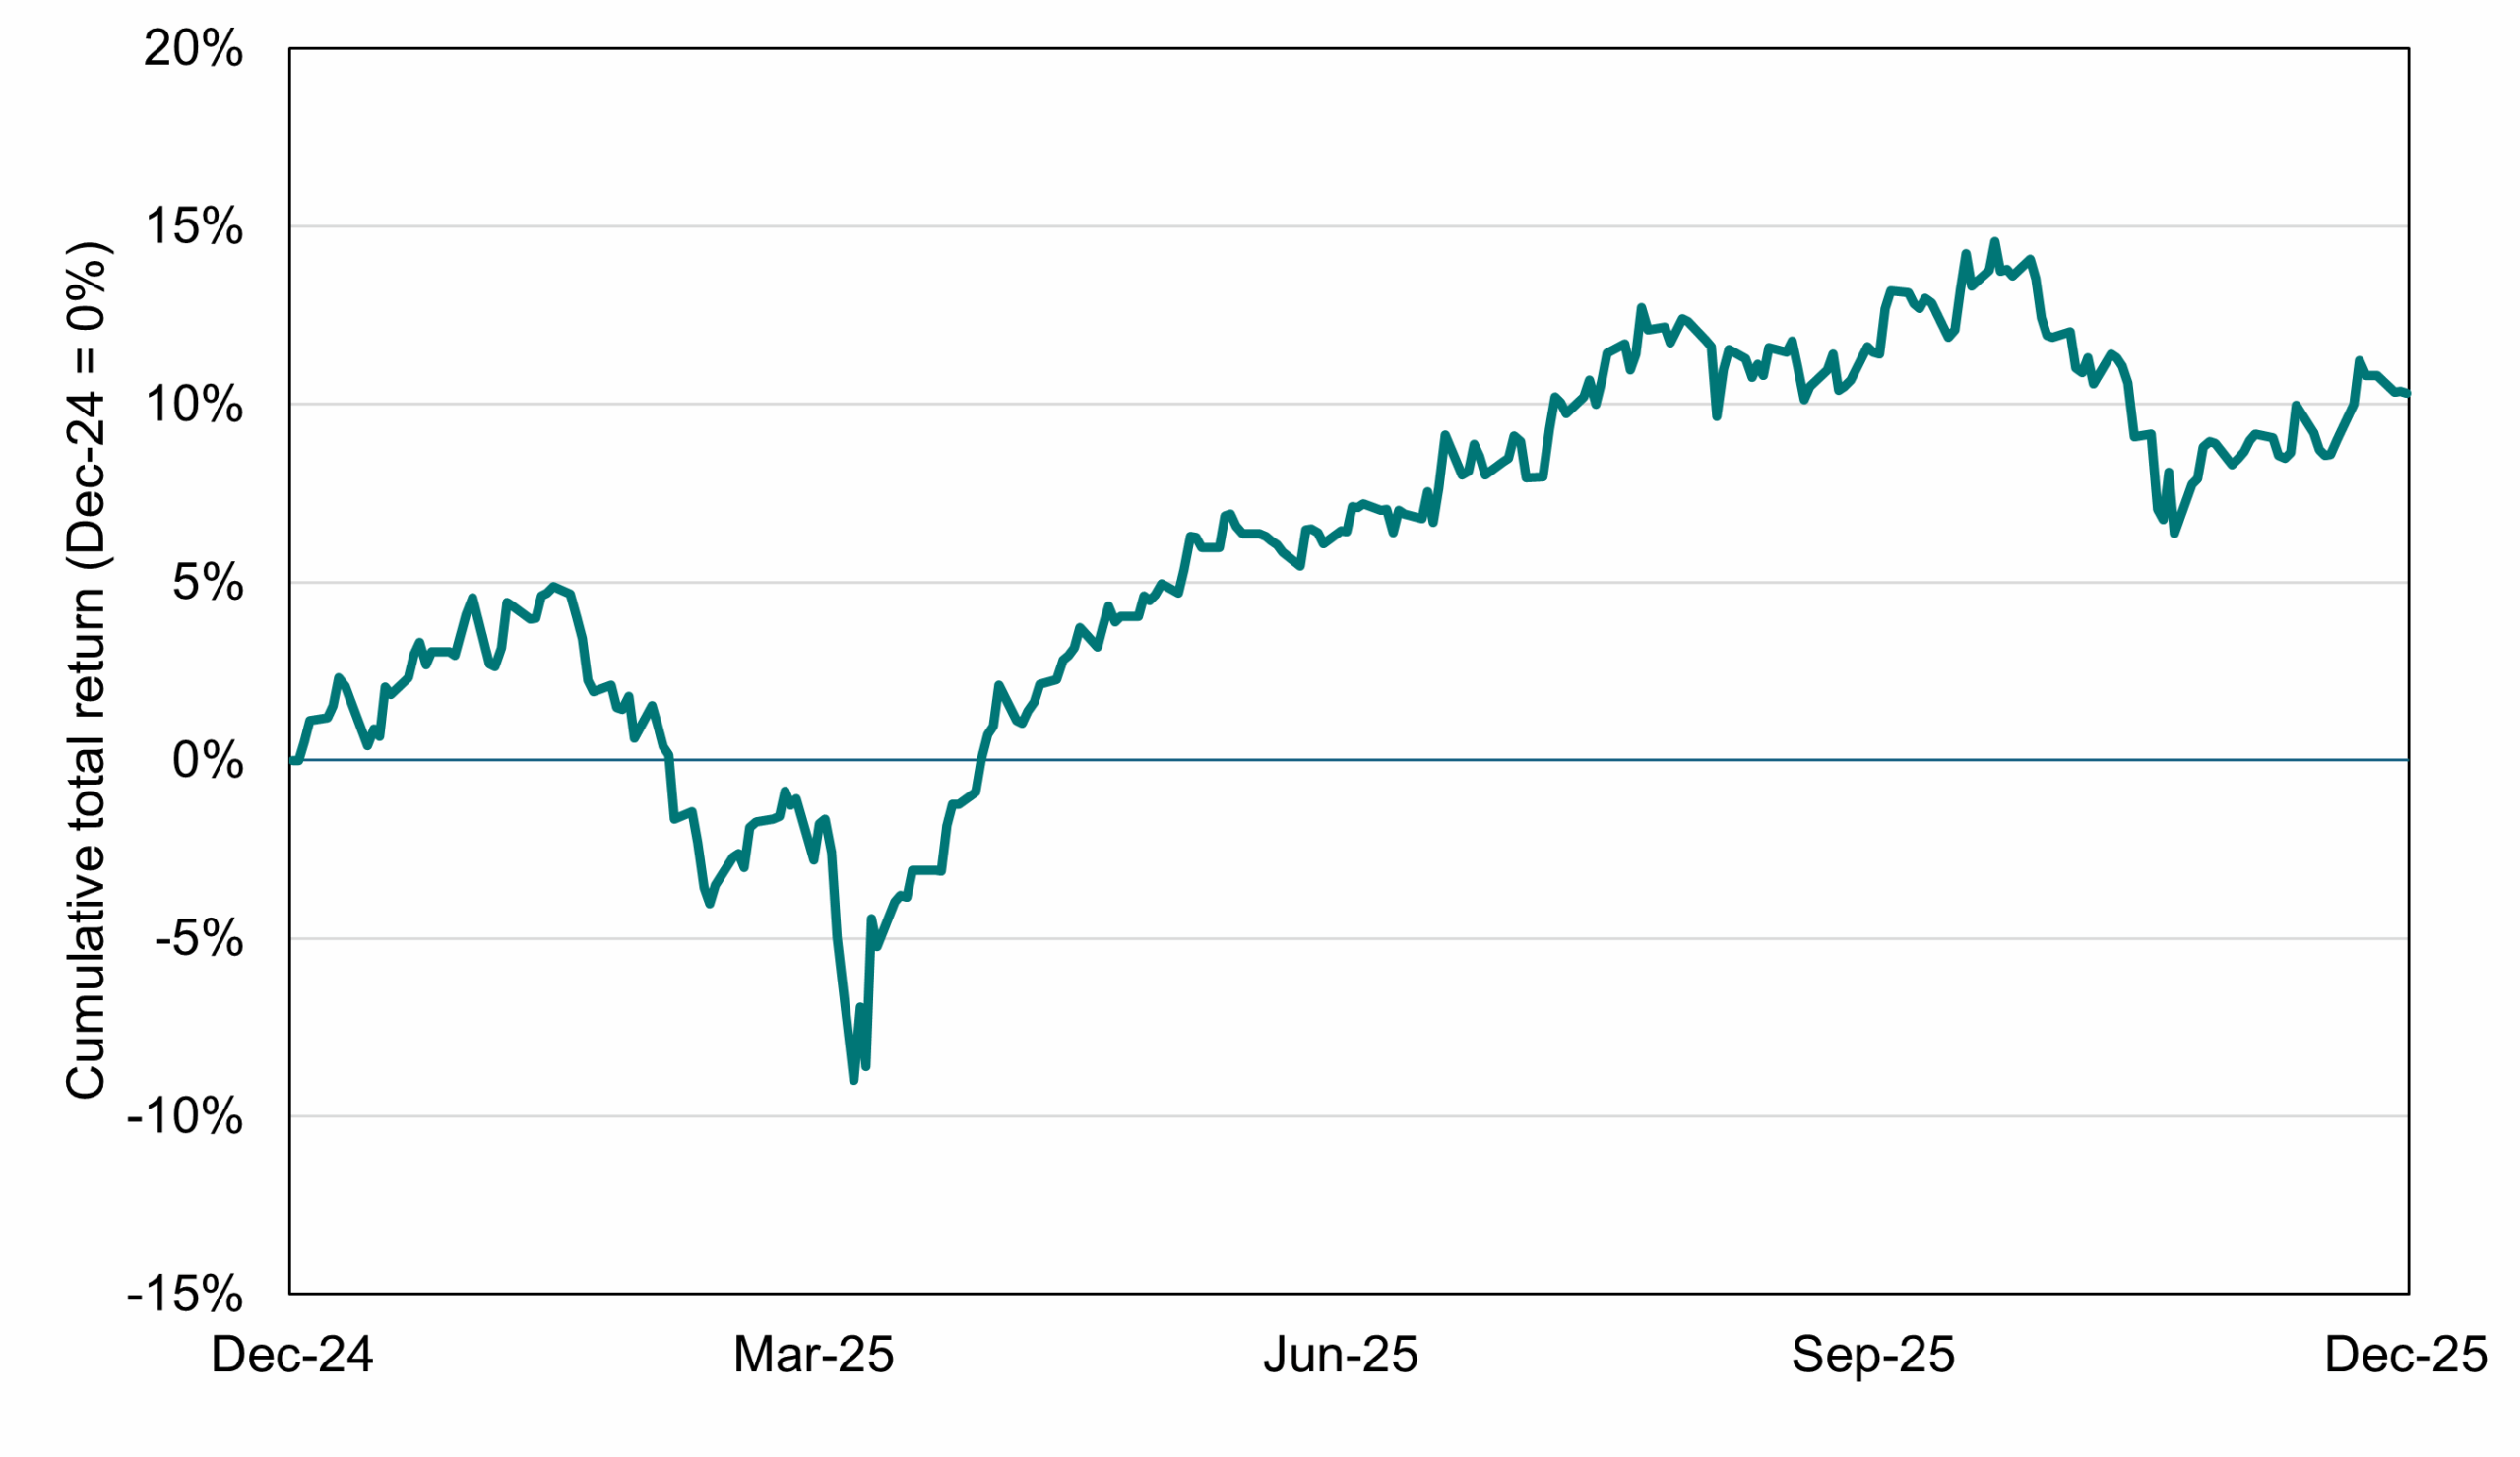
Source: Bloomberg
Outlook
Recommendation: Maintain underweight.
The overriding challenge for the Australian market lies in the valuations still being paid for our largest sectors. Commonwealth Bank (CBA) still accounts for over 10% of the benchmark index and has underperformed notably in 2025 with only a 4.8% increase in its share price. Despite its relative weakness, banking sector valuations still imply an exuberant future. The most notable shift has been the step change in sentiment for laggard bank ANZ Group which has seen its share price climb over 26% this year following a change in leadership and the prospect of bigger efficiency gains. It remains to be seen whether these expectations will be realised. A resilient Australian economy will support major banks by limiting the degree of unemployment and subsequent loan losses that might occur. In addition, the prospect of rate hikes may improve earnings power as banks are better placed to profit competitively through their deposit base (delays to passing on rate hikes to depositors can translate to sizeable tailwinds for profitability). These are all reasonable positives to take away. They still do not, however, in our assessment warrant a sector trading at growth-stock multiples. We would need to see a step change in economic fortunes with above-trend growth to arguably justify current levels. This is not our base case and an underweight remains warranted.
Sector versus Australian market valuations as at 31 December 2025
| Sector | Spot | 20Y median | Move to revert to median |
| Banks | 19.3x | 12.7x | -34.1% |
| Consumer Discretionary | 23.3x | 16.8x | -28.0% |
| A-REITs | 17.7x | 14.6x | -17.3% |
| Materials | 14.4x | 12.6x | -12.9% |
| Australian market | 18.3x | 14.7x | -19.5% |
Source: Bloomberg, PPSPW calculations
At the consumer level household spending has remained resilient in 2025 and inflected higher in more recent months. Consumer events such as Black Friday have changed the retail landscape with spending increasingly concentrated over the October-November period. A steady labour market should support ongoing sales growth.
Notwithstanding, valuations in the consumer discretionary sector remain high by historical standards and do not, in our view, sufficiently capture the risk of a pickup in interest rates or variability in future economic cycles. That assessment requires nuance however given the size of sector heavyweight Wesfarmers which possesses one of Australia’s preeminent brands in home improvement store Bunnings. It warrants trading at a premium to the broader market given above-market profitability and more resilient growth. Even there however we must acknowledge sensitivity to higher interest rates which more typically weighs on housing construction as well as renovation activity, both drawcards for Bunnings spending. On balance we think the combination of higher rates and already optimistic valuations warrants an underweight position.
Major miners have been a notable surprise performer in 2025 comprising the strongest sectoral performance. Strength in iron ore prices has been a critical feature. The sustainability of that strength is of more concern, however. We have the prospect of increasing production from Rio Tinto’s new megaproject, Simandou. In addition, China, a major source of demand, may be reaching a near-term peak with port inventories trading near cyclical highs. Historically, higher inventories have led to lower iron ore prices as it takes time to destock.
China iron ore port inventories vs iron ore price (Dec-15 to Dec-25)
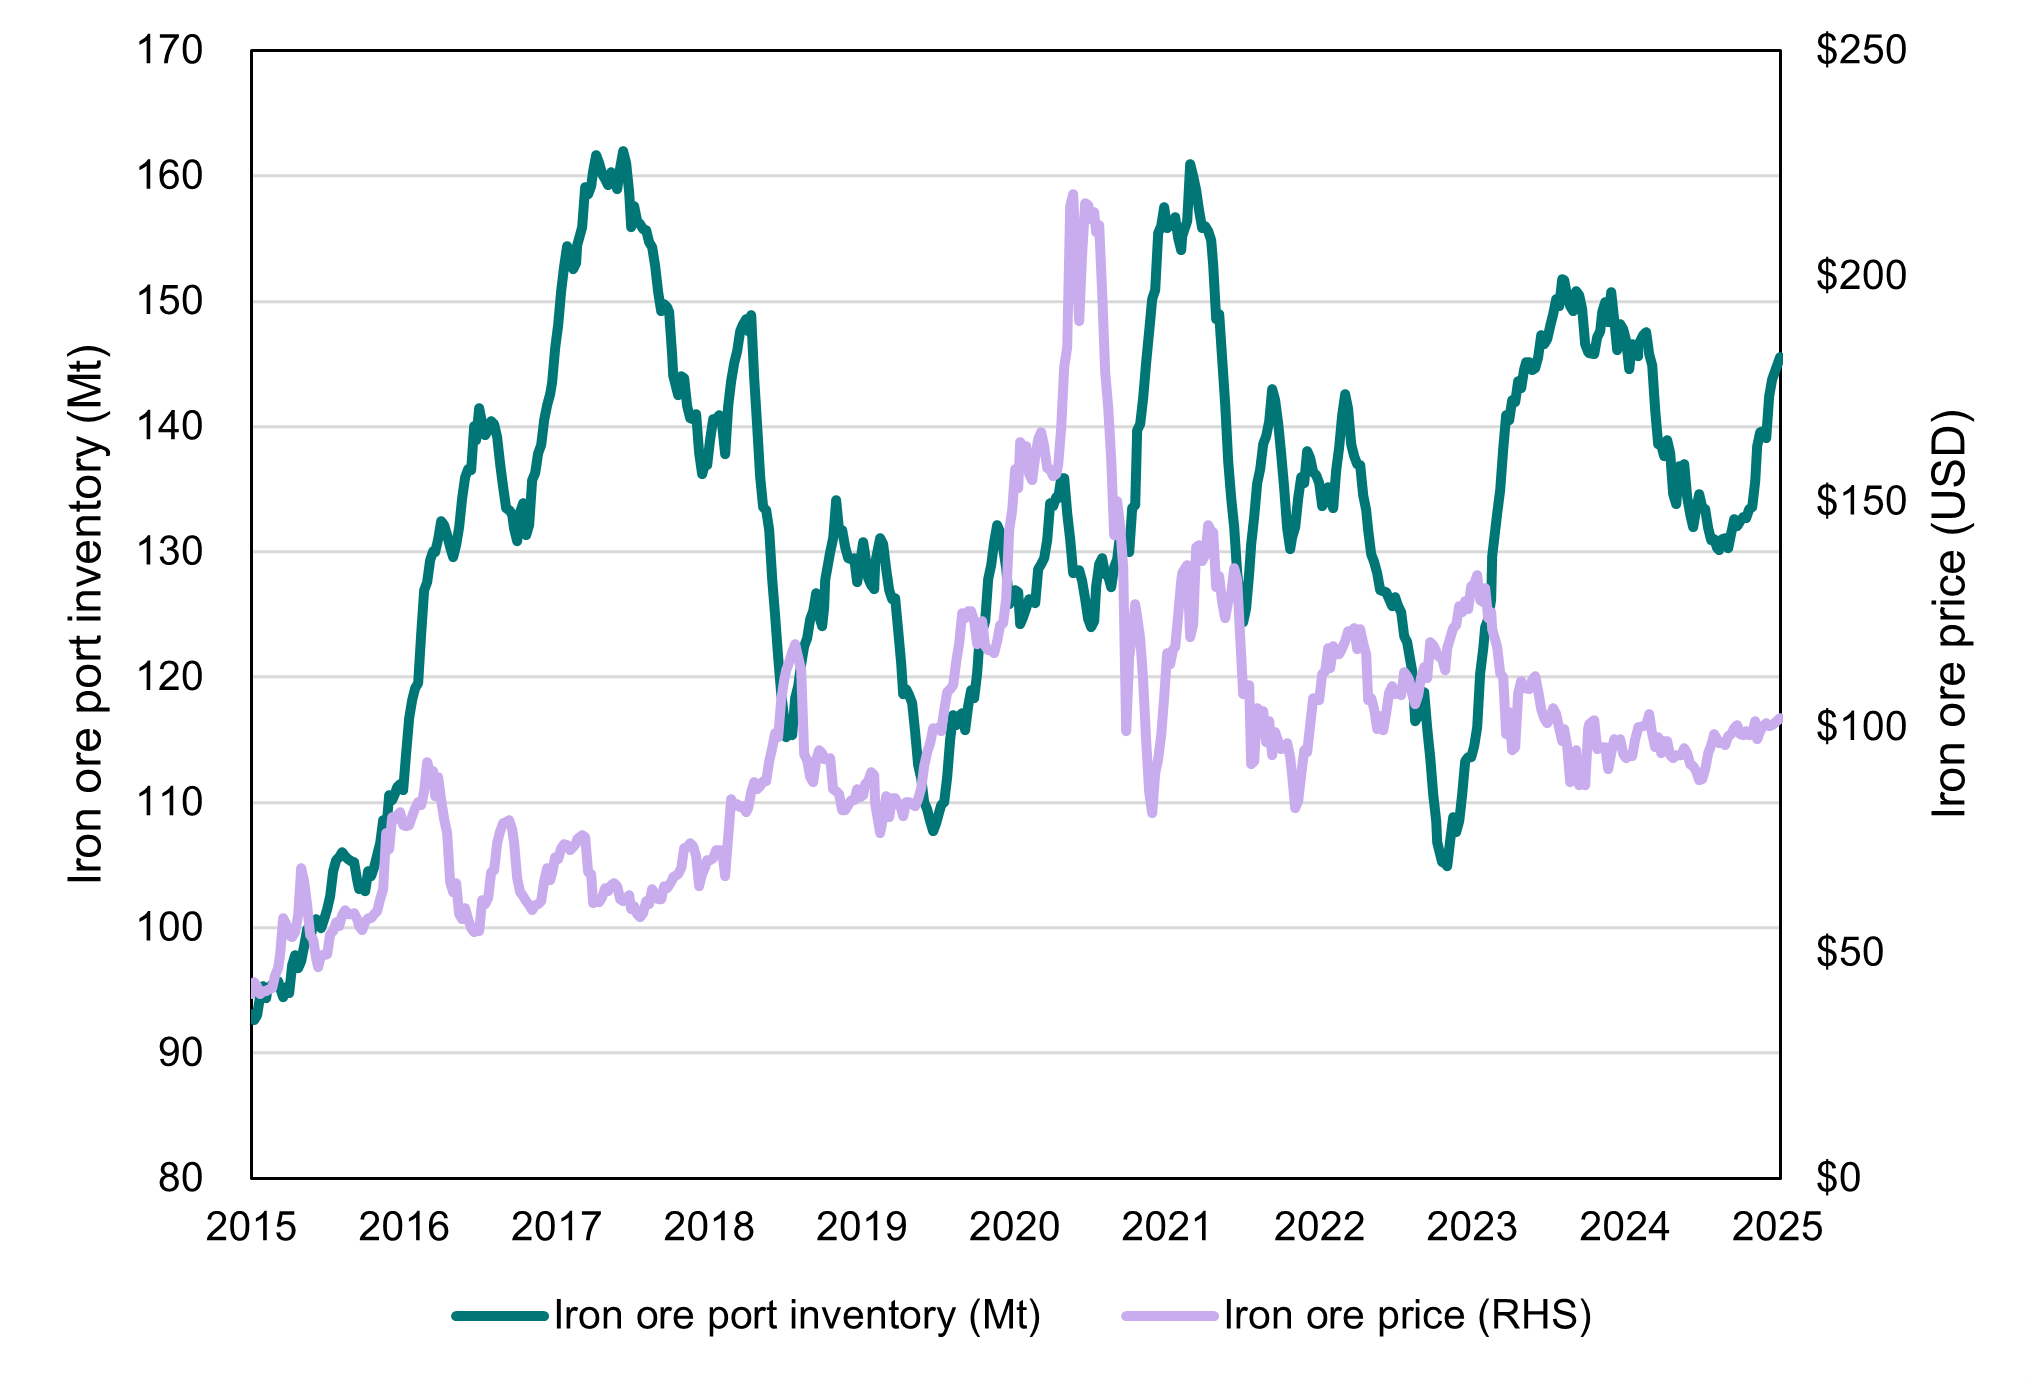
Source: Bloomberg, PPSPW calculation
Valuations are also a potential worry. Whilst miner earnings are volatile given their sensitivity to commodity prices, the fact that cheaper valuations tend to coincide with stronger returns has tended to be borne out by history. We only have one example in 2016 where the starting valuation still saw a strong year of performance and this was subject to mitigating factors such as extremely low starting inventories that needed to be replenished, a powerful tailwind.
Materials sector forward P/E ratio versus next-year’s return (2005 to 2024)
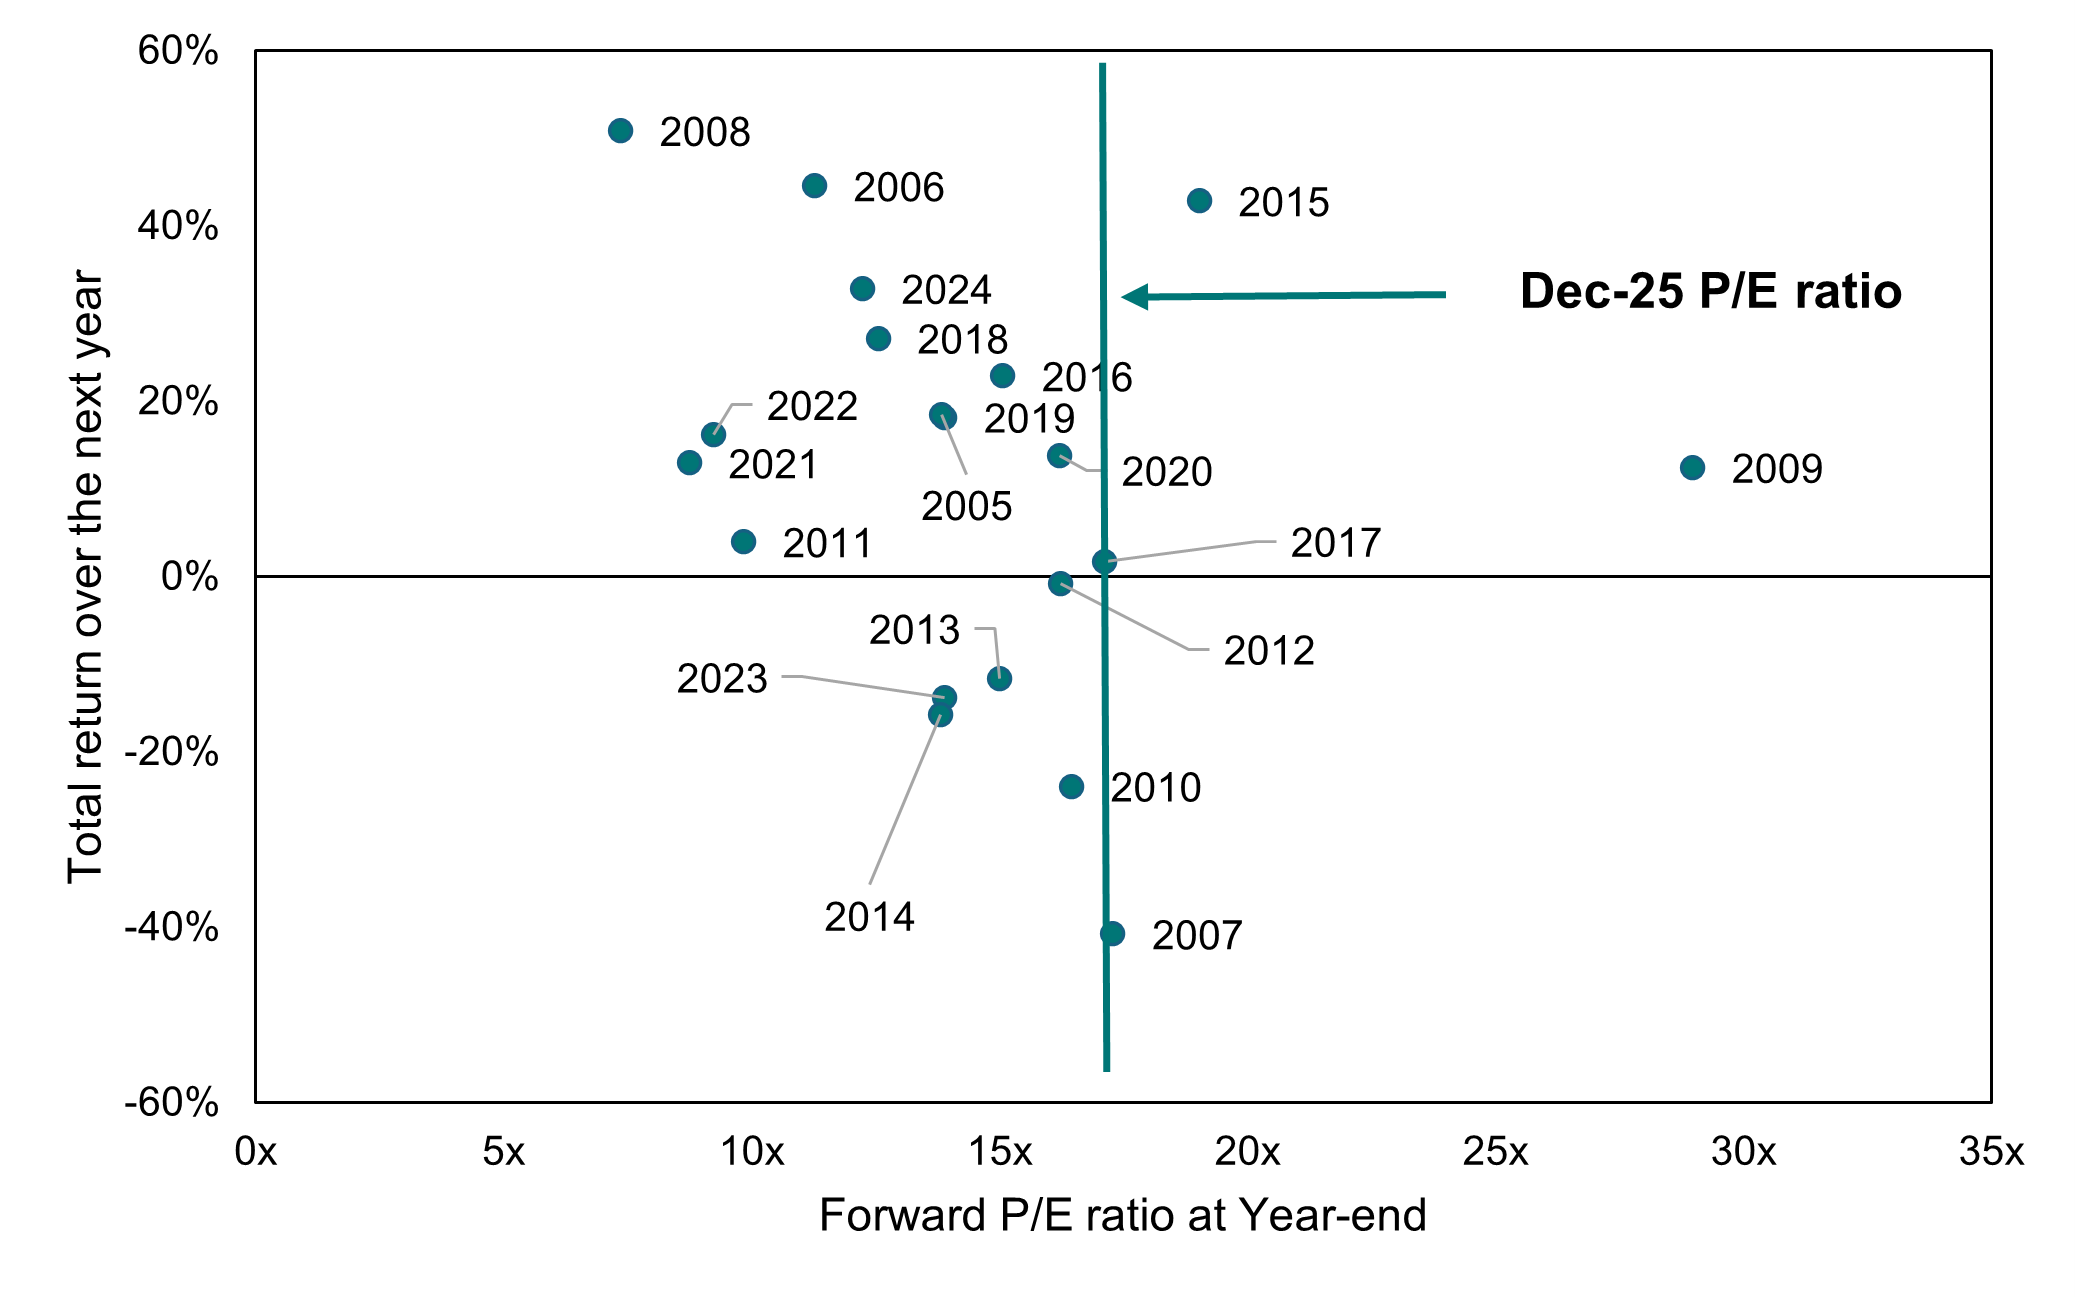
Source: Bloomberg, PPSPW calculations
On balance the near-term factors suggest taking profits from the recent strength in the mining sector.
Finally in A-REITs we have a stepdown in returns in recent months (now flat for FY26) as the prospect of higher interest rates has weighed on sentiment. While we remain optimistic on the tailwind of AI for sector giant Goodman Group (GMG) we must acknowledge the threat posed by higher rates. A-REITs are amongst the most levered companies in the Australian market with returns sensitive to the cost of capital given the amount of borrowing required to acquire or develop new assets.
The valuation headwind since the pandemic appears to have largely stabilised across the major sectors (see chart below). This bodes well for future returns as investors benefit from a mix of distribution and rental growth without the slow grind downwards in property prices. Valuation at a head stock level is problematic for the sector, however. In part this is influenced by the higher quality and growth prospects of Goodman Group. Valuations at a sector level are not at especially attractive levels though we acknowledge that this can change rapidly depending on the interest rate outlook.
In summary, we think a stabilisation in the interest rate outlook is needed before we can see meaningful price growth for A-REITs. While there are attractive fundamentals, we do not see sentiment improving until rate hike fears subside. Consequently, an underweight posture is warranted.
Australian property capitalisation rates (Nov-15 to Nov-25)
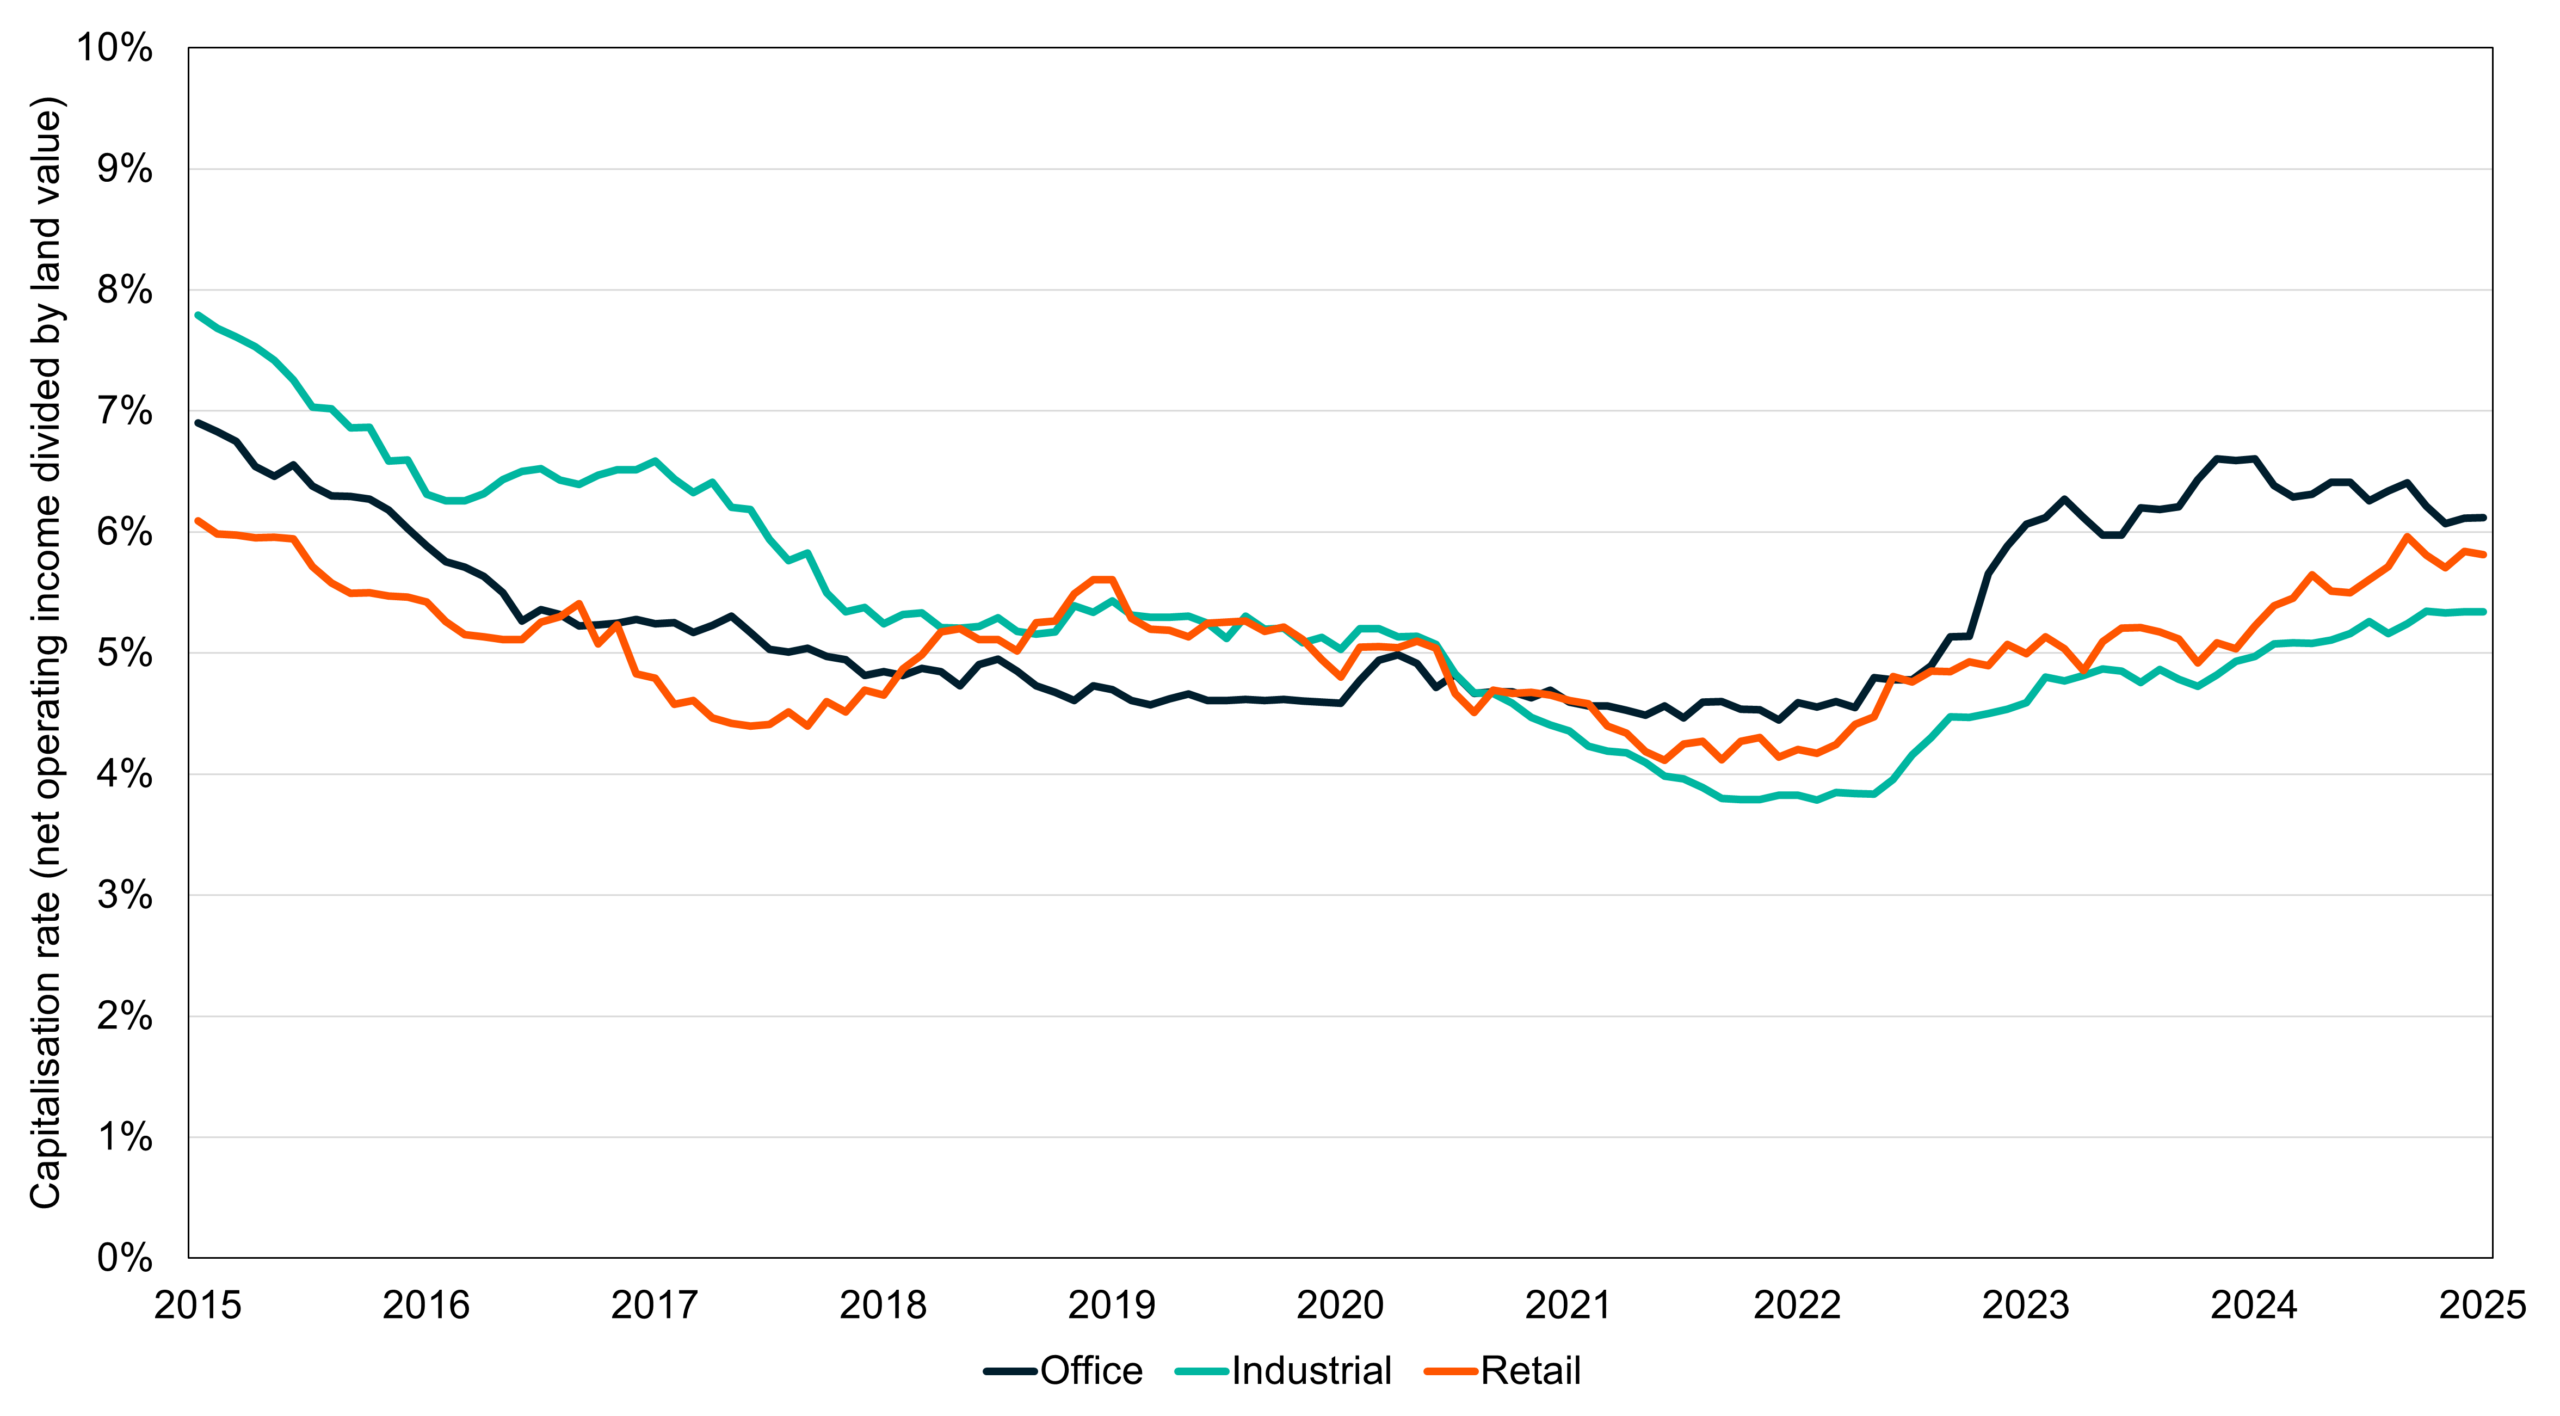
Source: Bloomberg
Conclusion
Recommendation: Remain underweight.
Despite modest falls in the Australian sharemarket over the last quarter, valuations remain well above long term averages against a backdrop of modest earnings growth expectations. Although there is some cause for optimism in 2026 as Australian economic growth is forecast to pick-up, we would argue that this is already largely reflected in market valuations. The Materials sector had been one pocket of relative value, but this has abated following recent price strength. In recent years market conditions have favoured passive investors, but this is likely to change in 2026 as more active investors are likely to be rewarded for taking advantage of more selective opportunities that have begun to emerge. Overall, though, we do not have the same level of dynamism in our economy to generate growth that would justify current valuations, unlike the US for example. Accordingly, we retain underweight positioning into 2026.