
International economic outlook: market insights for January 2026
The information in these articles is current as of 1 January 2026.
Part 1: Overview
2026 is shaping up to be a year of less “shock and awe”. Trade policy this year triggered sizeable volatility in both economies and markets. There though, the dust appears largely settled. The US is seeing a pickup in household and investment spending that may see growth surprise on the upside. Meanwhile in both China and Europe policymakers continue to maintain accommodative policies that will support global growth via a mix of fiscal stimulus, looser monetary policy and heightened defence spending.
United States
The Federal Reserve (The Fed) has a dual mandate to both maximise employment while ensuring inflation remains contained and stable. In recent months its focus has shifted firmly towards supporting the economy despite signs that inflationary pressures remain high.
The unemployment rate for November rose to 4.6%, its highest level since September 2021, a period that was marred by the pandemic. Recent college graduates now have an unemployment rate of 5.8%, the highest level since 2013 [1]. Whilst some have attributed this to AI-related disruption, the reality is more likely to be less confidence from businesses to hire amidst volatile policymaking by the Trump Administration. Consistent with this view we have seen labour demand ease with job vacancies at 7.67m in October, well below the peak of 12.1m in March 2022.
Inflation has shown some signs of cooling with the November result pointing to core inflation of only 2.6%, well below consensus forecasts. This result is problematic with the 43-day government shutdown limiting the coverage of data gathering efforts and casting doubt on its accuracy. As a counterpoint the New York Fed’s Core Trend Inflation measure (refer graph below) highlights the likely trend at present is of stable, but still elevated levels, closer to 3% as opposed to the sub-2% range that defined the pre-pandemic period.
US inflation trends – actual and estimated (Sep-05 to Sep-25)
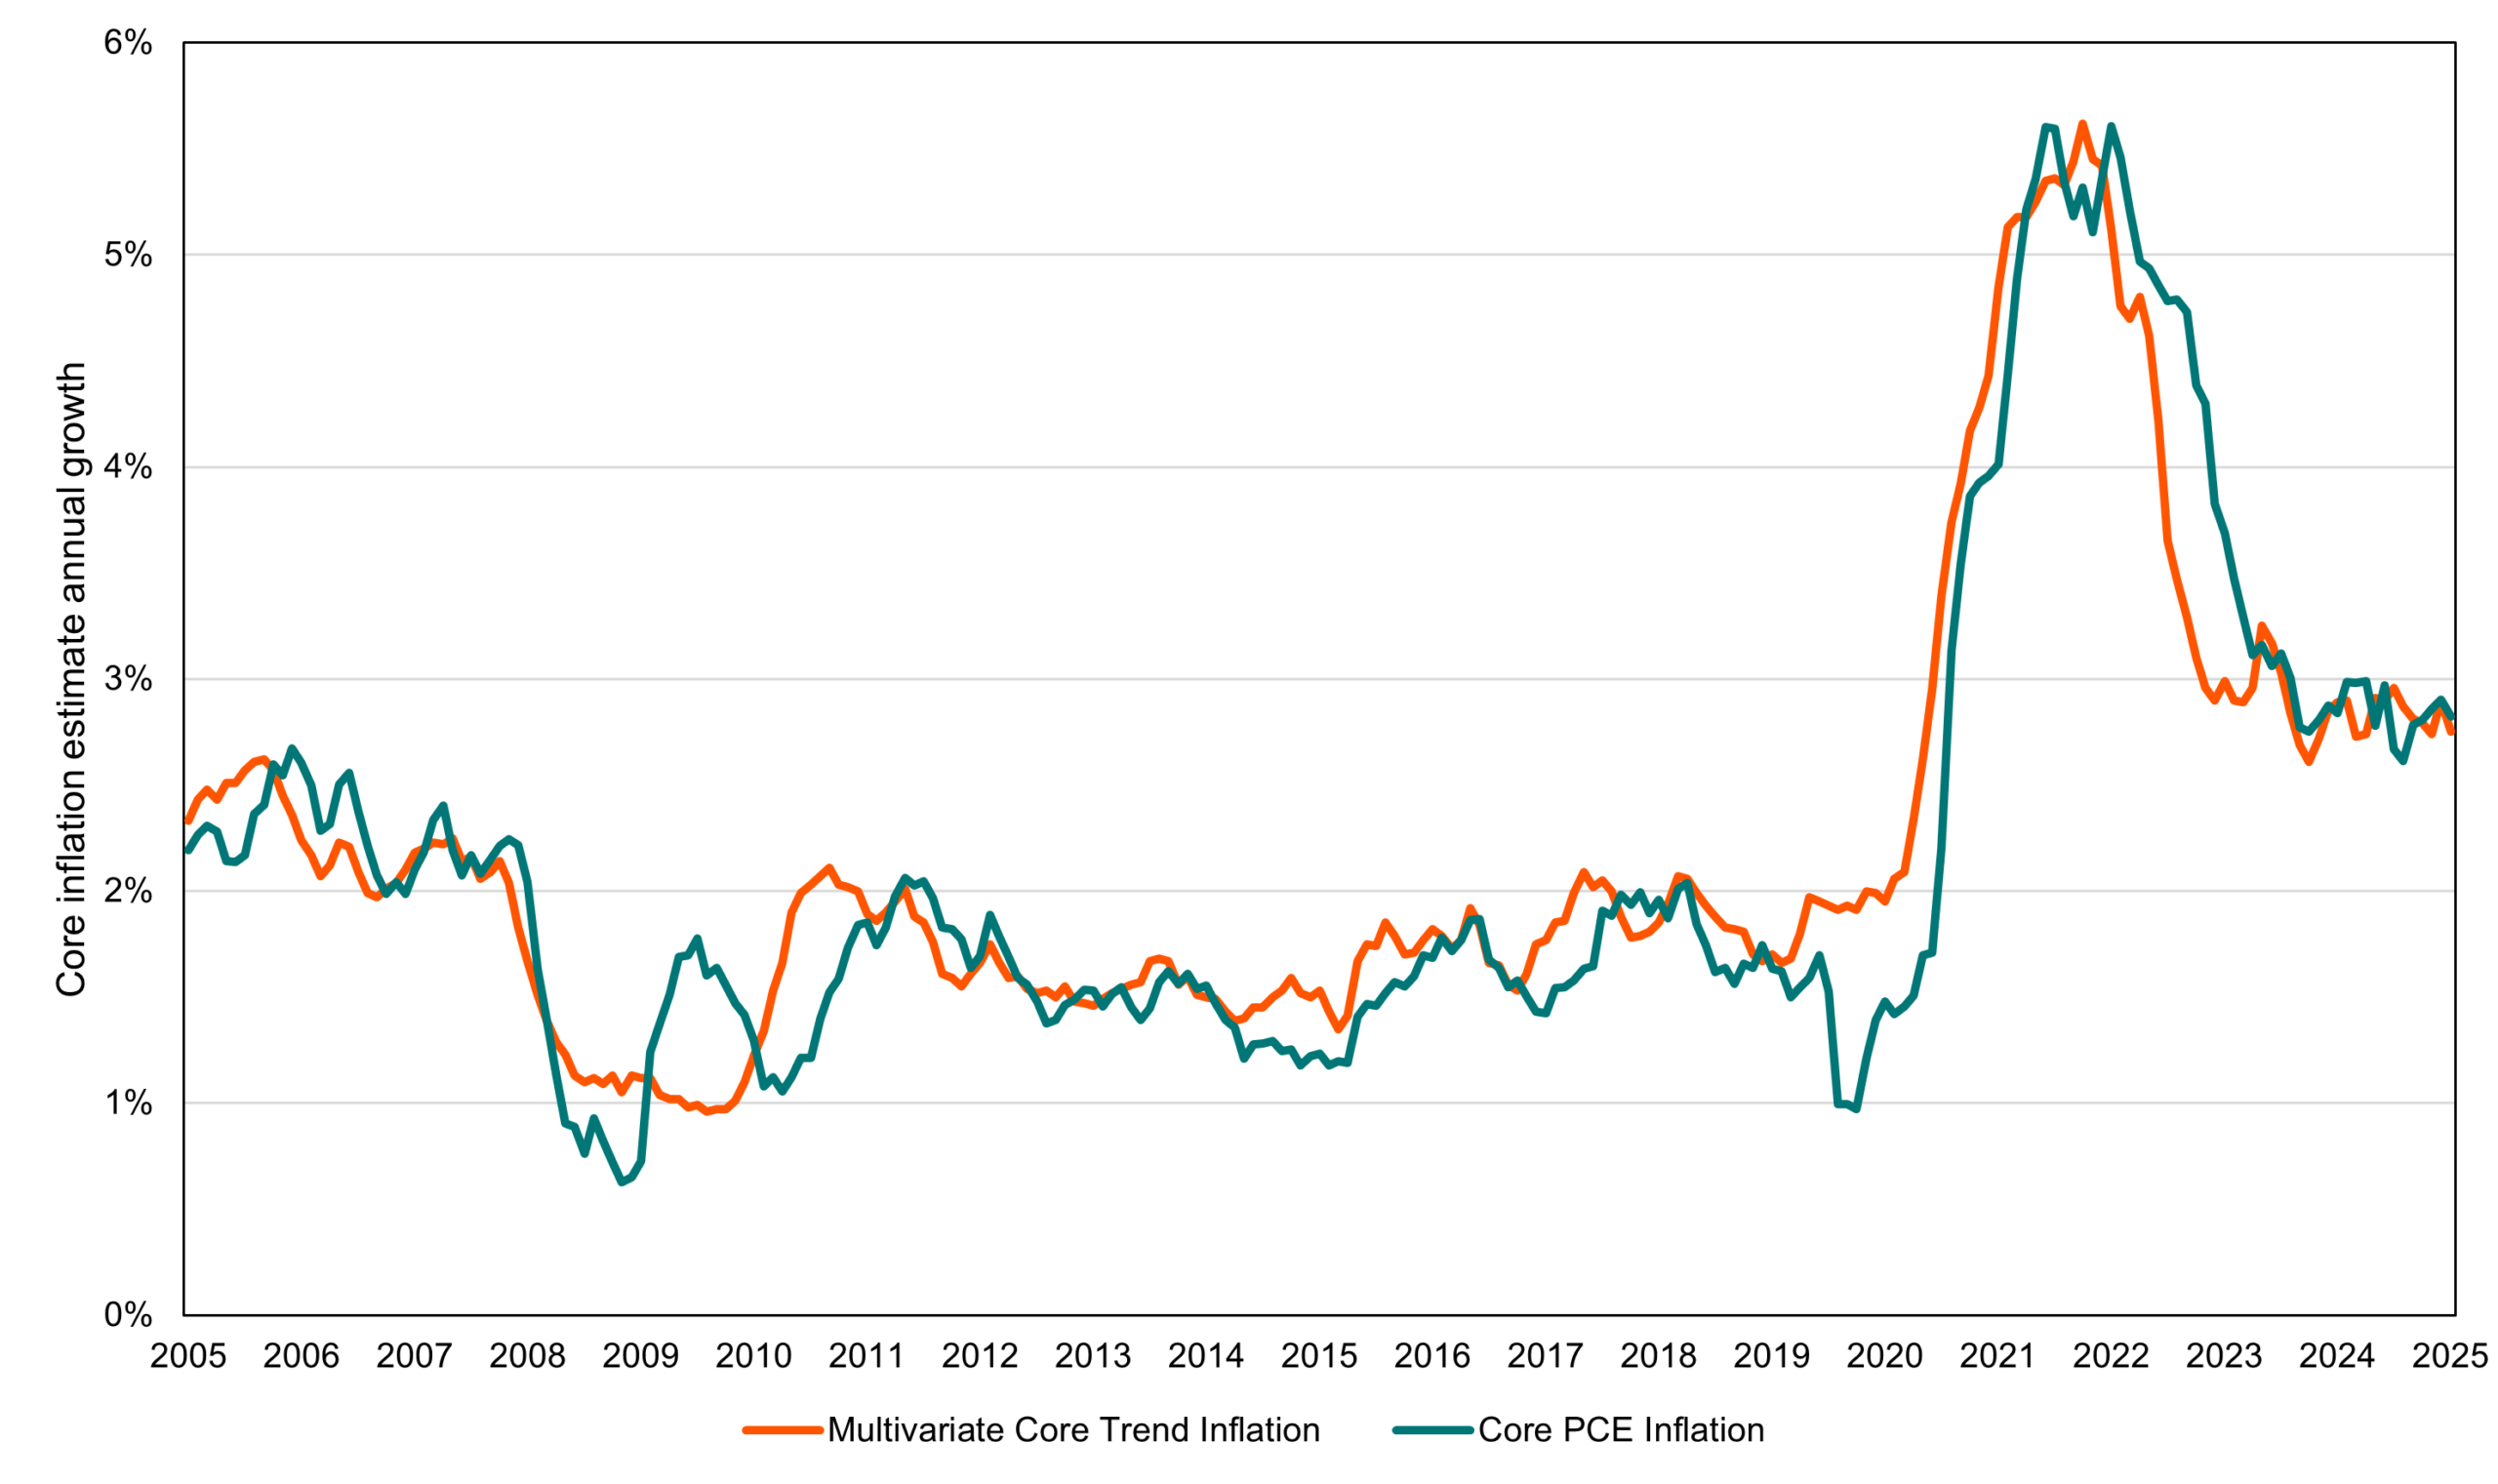
Source: NY Fed, Bloomberg
2026 will also be defined by President Trump’s choice of the incoming Fed chairman. The President has been clear in his desire for lower interest rates and that he expects the incoming chair to reciprocate these views [2]. We can see this being reflected in the pricing of interest rate expectations with up to three cuts by the end of 2026 being predicted.
Against this backdrop US growth may yet surprise on the upside. AI investment is acting as a material tailwind for the US. Bank of America for example has cited tax rebates, consumer spending and AI investment acceleration driving growth closer to 2.4%, up from 2% currently. The consumer has held up stronger than expected amidst tariff disruptions with GDP growth surprisingly strong in the September quarter at 4.3% on an annualised basis, a full 1 per cent ahead of consensus. This was driven by a mix of household demand and net export strength. The latter is likely a mirage given the impact of tariffs as a one-off drag on import demand. Consumer spending however is expected to remain well supported by wage growth (moderated to 4.1% for the year to November according to the Atlanta Fed but still above pre-pandemic levels of 2.8% p.a.) and elevated household savings balances.
Median checking and savings deposit balances by income (Jan-19 to Nov-25)
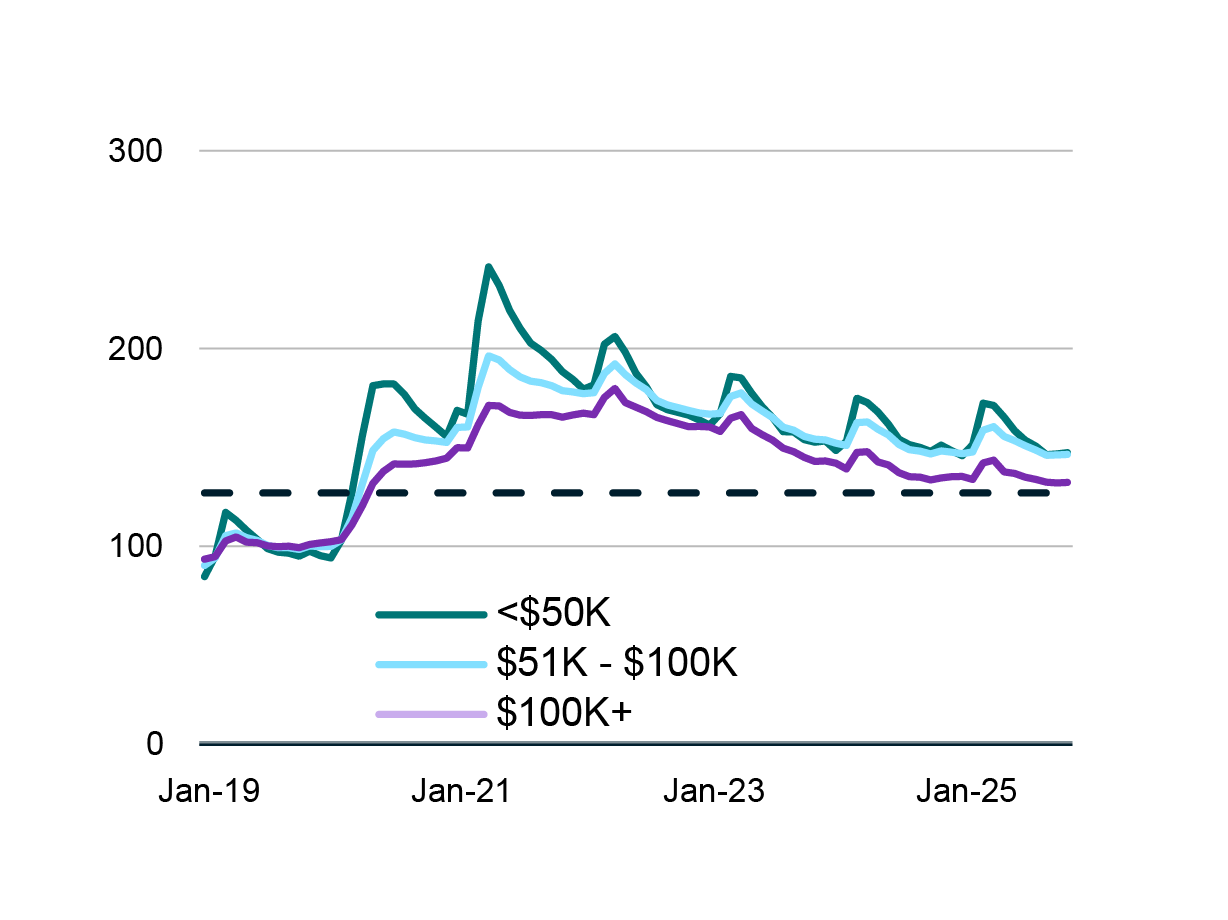
Source: Bank of America Consumer Checkpoint December 2025 [3]
Finally, AI capital spending is expected to continue growing into 2026 and potentially have an even larger impact. For the year to September spending on information processing and equipment contributed 0.8% to the overall growth of 2.3%, a meaningful uptick on recent years and with scope to rise further.
As it stands today the US economy is positioned reasonably well for continued growth even amidst modest signs of higher unemployment. The policy environment will be supportive next year notwithstanding concerns over inflation. Barring a surprise economic shock, we expect a reasonable expansion for 2026 with recent labour market weakness insufficient to derail current momentum.
China
Fears of a sharp downturn in exports following the Liberation Day tariffs have not come to fruition. Instead, China has managed to reroute trade through Asia, resulting in a trade balance that has continued to expand markedly with every major region excluding the US and reached over US$1 trillion for the first 11 months of 2025.
China annual trade balance split by region (Nov-15 to Nov-25)
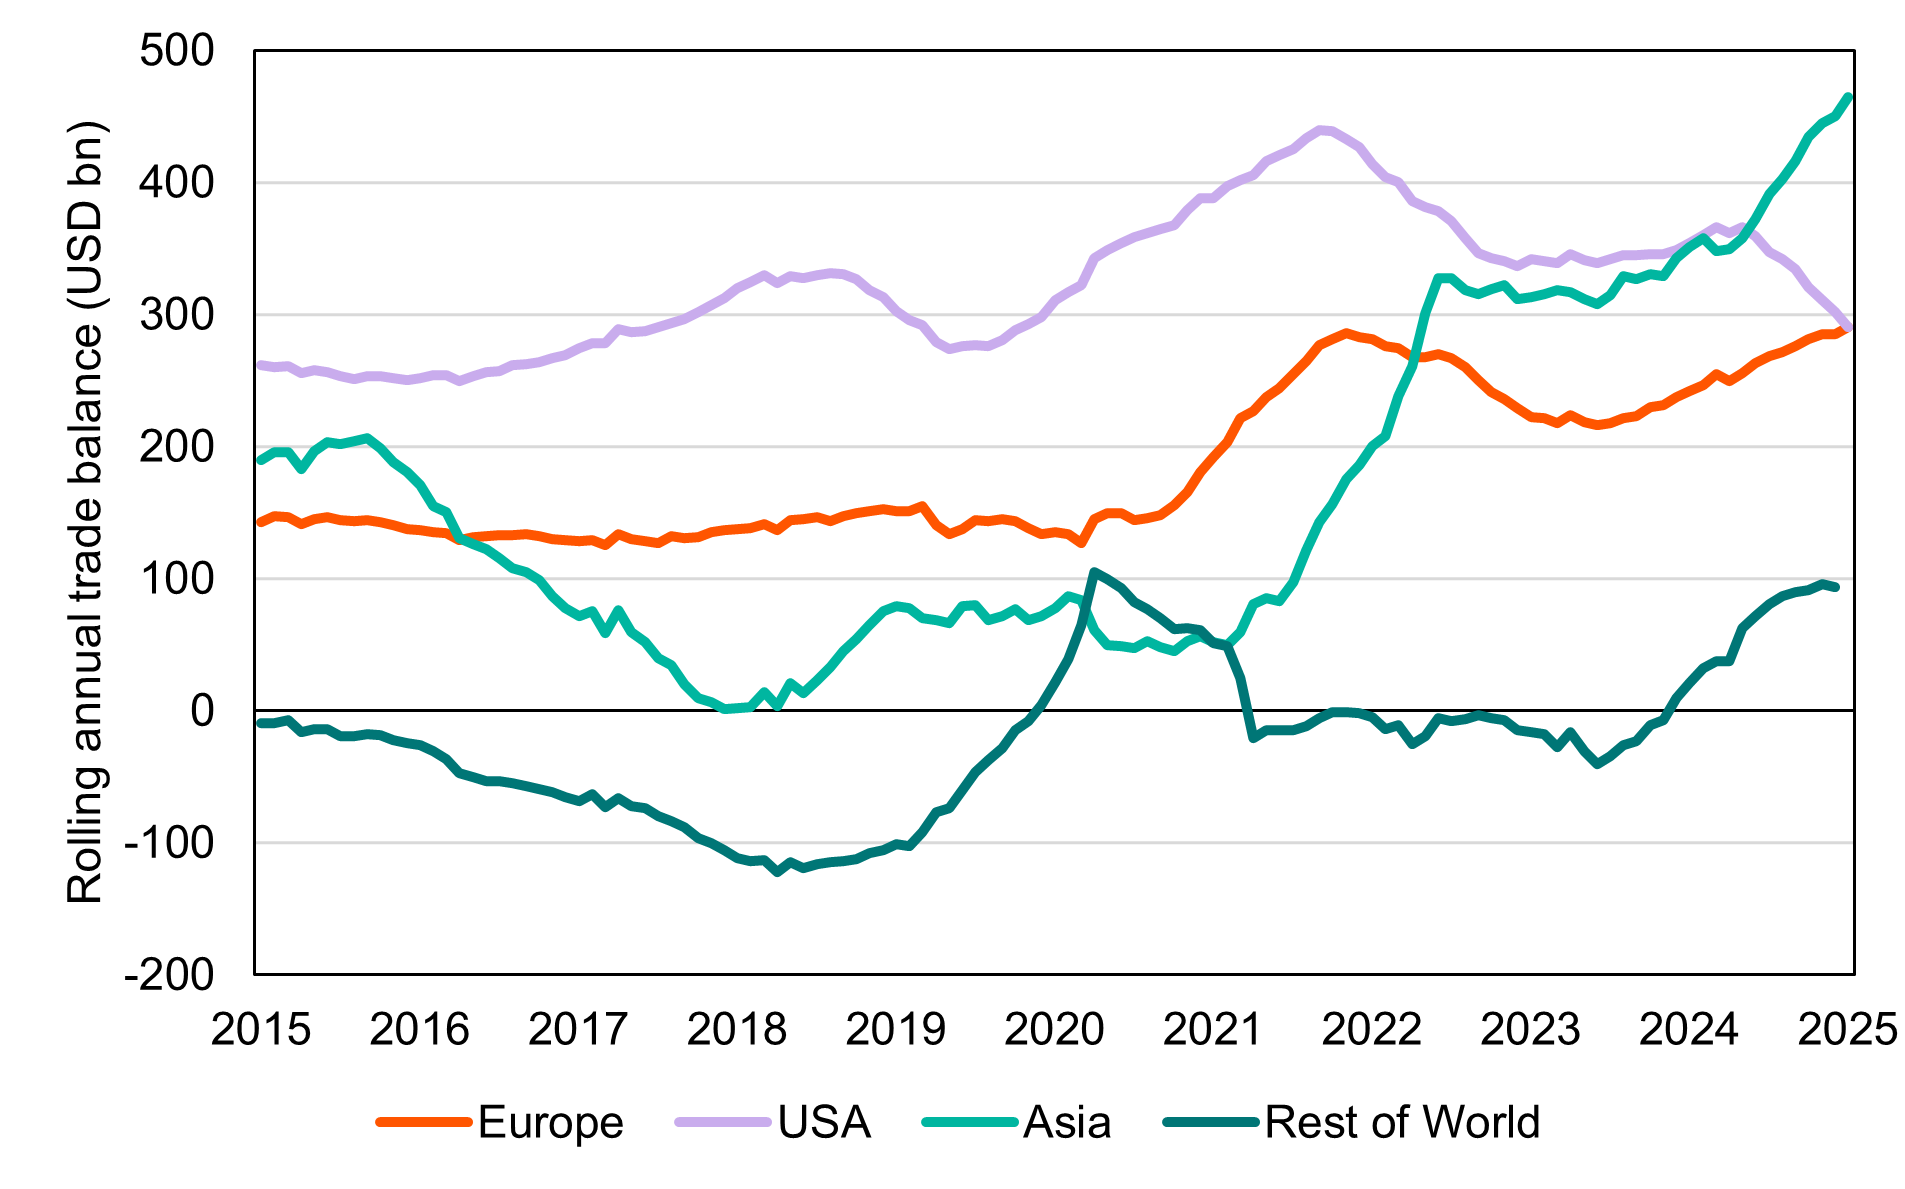
Source: Bloomberg, PPSPW calculations
China has doubled down on an export-led growth model as authorities encourage a strategy of “going up-market” for manufacturers looking to increasingly produce goods at the forefront of advancement for given sectors. The automobile sector has been one such priority, semiconductors another but what is key is the breadth of this commitment.
We expect this export led domination to continue in 2026. China’s success however has come at a cost to a vast number of industries in other countries that can no longer compete. The risk of a broader scale tariff backlash remains ever present. For example, the EU has already embarked on efforts to tariff electric vehicle exports from China and there is an increasing risk that these could broaden in scope to protect local industries.
Despite being the world’s largest factory, household spending in China remains weak, with retail sales growing a paltry 1.3% for the year to November. With excess production being churned out of China’s factories, consumer inflation is also anaemic running at a mere 0.7% over the same period. The producer price index, a measure of the prices received by manufacturers for their final products, has remained firmly deflationary since late 2022. It declined a full 2.2% for the year to November, a more glaring sign of oversupply afflicting the Chinese economy.
These are not figures consistent with a healthy household sector. Absent targeted government stimulus or renewed efforts to encourage more equitable redistribution, we do not expect this to change much. Nevertheless, there is speculation that the government will maintain a deficit target at 4% of GDP in 2026 [4] which would be constructive for growth overall. Much of the recent funding has gone towards building out advanced manufacturing capabilities rather than direct household support.
In conclusion, China is likely to achieve its 2026 consensus growth forecast of 4.5% via a continuation of stimulus measures to support advanced manufacturing and export led growth. It remains to be seen if China will unfold new measures to encourage household consumption.
Europe
In Europe growth conditions remain modest. The Flash Markit Composite PMI for December sat at 51.9, a three-month low but one that highlighted the first full year of consistent monthly expansion since the pandemic began [5]. The services sector has been key to this backdrop with resilient demand in contrast to the manufacturing sector which saw a slight contraction, driven in part by continued weakness in the export sector. These conditions point towards positive, albeit weak, growth persisting relative to other developed markets such as the US.
One factor that might change this dynamic is more forceful government spending. There we are seeing some positive signs with the turnaround in Germany’s official stance to more openly consider deficits. ING Economics sees this shift translating into economic growth of 1% and 2.7% for 2026 and 2027 respectively [6]. These forecasts may be hampered by structural challenges such as the slow approval process [7] resulting in a much slower rollout of public investment spending than previously anticipated. Meanwhile in France, efforts to approve the government’s budget to help reduce its fiscal deficit and improve its long-term sustainability have been thwarted by political infighting. This is likely to lead to growth underperforming that of the broader Eurozone [8]. Lastly Spain may be a source of continued potential upside with only €59bn of a possible 163bn being received as part of the EU Recovery and Resilience Facility. This could support growth through improved productivity as the result of new investment spending efforts. These data points suggest fiscal policy could offer some tailwinds, but the impact will be somewhat stymied by a mix of political and structural challenges.
The European Central Bank (ECB) has been supportive with its easing bias in recent years with its key deposit rate being cut to 2% as of December, down markedly from its Nov-23 peak of 4%. Its job has been made easier with inflation at more modest levels than other developed markets as the latest result saw headline inflation of only 2.1% for the year to November. If weaker growth conditions arise, we would expect additional easing to be forthcoming. Annual growth has improved from its low point of 0.1% in September 2023 to 1.4% two years later but remains subdued and vulnerable to shocks in view.
In the near-term we expect modest growth conditions to persist with some upside risk to be found in increased defence spending within Germany as well as growing investment within Spain. A shift in political will and action particularly in France, the bloc’s second-largest economy, is needed however to form a more optimistic outlook.
Conclusion
While 2025 was marred by its share of geopolitical challenges we expect 2026 to see reasonable growth conditions persist with policy support remaining a key feature of the global economy. Trade relations could well reappear as a source of tension with real concerns persisting about China’s impact at a global scale. AI investment will also loom as a tailwind for growth, but productivity gains will need to be achieved in order for current spending to be sustained.
Part 2: Key economic indicators
United States
| Economic snapshot | 2026e | 2027e |
| Growth (GDP) | 2.0% | 2.0% |
| Inflation | 2.8% | 2.5% |
| Interest rates | 3.2% | 3.2% |
| Unemployment rate | 4.5% | 4.3% |
Eurozone
| Economic snapshot | 2026e | 2027e |
| Growth (GDP) | 1.2% | 1.4% |
| Inflation | 1.8% | 2.0% |
| Interest rates | 2.0% | 2.0% |
| Unemployment rate | 6.3% | 6.2% |
China
| Economic snapshot | 2026e | 2027e |
| Growth (GDP) | 4.5% | 4.3% |
| Inflation | 0.7% | 1.0% |
| Interest rates | 1.4% | 1.4% |
| Unemployment rate | 5.1% | 5.1% |
References
[1] G. Friesen, ‘Unemployment Crisis: Why College Graduates are Struggling in 2025′, Forbes (23 October 2025). Read the full publication (accessed 28 December 2025).
[2] J. Ward, ‘Trump says next Fed chair will believe in lower interest rates “by a lot” ’, Reuters (18 December 2025),Read the full publication (accessed 20 December 2025).
[3] ‘Consumer Checkpoint: Merry but Measured’, Bank of America Institute (10 December 2025), Read the full publication (accessed 15 December 2025).
[4] F. Chen & S. Mai, ‘China to keep high fiscal deficit ratio in 2026 to buoy spending plans: analysts’, South China Morning Post (12 December 2025), Read the full publication (accessed 15 December 2025).
[5] ‘HCOB Flash Eurozone PMI December 2025’, S&P Markit (16 December 2025), Read the full publication (accessed 17 December 2025).
[6] C. Brzeski, C. de Montpellier, P. Pizzoli & R. Dewitte, ‘Waiting for a sudden surge: the Eurozone’s Big 4’, ING THINK (4 December 2025), Read the full publication (accessed 6 December 2025).
[7] S. Kooths, ‘Fiscal stimulus masks structural weakness’, Kiel Institute (25 September 2025), Read the full publication (accessed 30 September 2025).
[8] Ibid as 6.