Key points:
- NVES penalties are already driving aggressive OEM behaviours that will distort pricing, squeeze dealer margins and expose which brands have the resilience to compete sustainably in the Australian market.
- As front-end margins tighten, performance will depend on controllable levers like used cars, fixed operations, disciplined sales processes and stronger F&I outcomes, which are becoming essential for profitability.
- Consolidation will accelerate while regulation adds complexity, and OEMs with thin volumes or weak networks will be forced to reconsider their place in Australia, making strategic discipline and scale critical for survival.
As we move into 2026, the Australian automotive landscape is shifting at breakneck speed. Regulatory pressures, margin compression, shifting consumer sentiment and intensifying OEM competition are converging to reshape the economics of dealerships Australia-wide.
From boardrooms to back-office operations, the decisions leader’s make over the next 12–18 months will define who thrives, and who exits.
Here are the top 10 drivers that will define Australia’s automotive industry in 2026.
1. NVES will drive flawed OEM strategies
The New Vehicle Efficiency Standard (NVES) formally takes hold, after penalties accrue from 1 July 2025, and its commercial consequences will become very real.
Some OEMs, are already demonstrating these types of behaviours including:
- Aggressive discounting,
- Tactical volume dumping (notable example being BYD as reported in the AFR),
- Limiting supply of some models attracting penalties,
- In some cases, limiting overall volumes (as a consequence of the penalty being effectively spread across total volume of the OEM), and
- Pressuring dealers to push stock that does not meet sustainable margin outcomes.
NVES will reshape product strategy and pricing, but it will also expose which OEMs are prepared to sacrifice long-term brand equity for short-term compliance wins. This has the potential to create extreme outcomes for those that implement a flawed strategy.
2. The best dealers will double down on used cars and their people
Top-tier operators know that used cars remain one of the last controllable levers in dealership profitability.
In 2026, we will see the best dealers strengthening:
- Their appraisal processes,
- Their reconditioning speed,
- Their ability to trade customers out of aging and under water loans,
- Their investment in people, training and culture
Used cars will be the performance differentiator, because new car margins simply are under significant pressure and cannot sustain dealer’s costs on their own.
NVES will play a part in the future of the used car market. With the impact of the penalties and the resulting flawed strategies by some OEMs, new vehicle sales will be reduced by virtue of outpricing the consumer and limiting choices (as OEMs look to exit the market, refer to item 10 below).
This will open the door to parallel imported vehicles making the used car market not only larger but more attractive to the consumer.
3. New vehicle volumes will lift, but margins won’t
We expect national new car sales volumes to rise as supply chains have ramped up, and population has boomed in the last 4 years. Refer below to the table showing new car sales volumes as a percentage of population.
| Year | New car sales (VFACTS) | Change | % Change | Population (Data catalog, World Bank, ABS) | Change | % Change | Car sales to population | + \ – average | + \ – volumes |
| 2010 | 1,035,574 | 98,246 | 10.5% | 22,031,750 | 340,097 | 1.5% | 4.7% | 0.2% | 52,333 |
| 2011 | 1,008,437 | (27,137) | (2.6%) | 22,340,024 | 308,274 | 1.4% | 4.5% | 0.1% | 11,439 |
| 2012 | 1,112,032 | 103,595 | 10.3% | 22,733,465 | 393,441 | 1.7% | 4.9% | 0.4% | 97,475 |
| 2013 | 1,136,227 | 24,195 | 2.2% | 23,128,129 | 394,664 | 1.7% | 4.9% | 0.4% | 104,057 |
| 2014 | 1,113,224 | (23,003) | (2.0%) | 23,475,686 | 347,557 | 1.5% | 4.7% | 0.3% | 65,543 |
| 2015 | 1,155,408 | 42,184 | 3.8% | 23,815,995 | 340,309 | 1.4% | 4.9% | 0.4% | 92,539 |
| 2016 | 1,178,133 | 22,725 | 2.0% | 24,190,907 | 374,912 | 1.5% | 4.9% | 0.4% | 98,533 |
| 2017 | 1,189,116 | 10,983 | 0.9% | 24,592,588 | 401,681 | 1.6% | 4.8% | 0.4% | 91,589 |
| 2018 | 1,153,111 | (36,005) | (3.0%) | 24,963,258 | 370,670 | 1.5% | 4.6% | 0.2% | 39,042 |
| 2019 | 1,062,867 | (90,244) | (7.8%) | 25,334,826 | 371,568 | 1.5% | 4.2% | (0.3%) | (67,784) |
| 2020 | 916,968 | (145,899) | (13.7%) | 25,649,248 | 314,422 | 1.2% | 3.6% | (0.9%) | (227,716) |
| 2021 | 1,049,831 | 132,863 | 14.5% | 25,685,412 | 36,164 | 0.1% | 4.1% | (0.4%) | (96,467) |
| 2022 | 1,081,429 | 31,598 | 3.0% | 26,005,540 | 320,128 | 1.2% | 4.2% | (0.3%) | (79,155) |
| 2023 | 1,216,780 | 135,351 | 12.5% | 26,588,782 | 583,242 | 2.2% | 4.6% | 0.1% | 30,167 |
| 2024 | 1,237,287 | 20,507 | 1.7% | 27,400,013 | 811,231 | 3.0% | 4.5% | 0.1% | 14,470 |
| 2025 (Avg Rate) | 1,241,396 | 4,109 | 0.3% | 27,816,316 | 416,303 | 1.5% | 4.5% | 0.0% | – |
| 2026 (Avg Rate) | 1,260,257 | 18,861 | 1.5% | 28,238,945 | 422,628 | 1.5% | 4.5% | 0.0% | – |
Source(s): VFACTS & Datacatalog, 2025 & 2026 estimated based on average historical rate of new car sales to population
But more stock inevitably brings:
- Higher days’ supply,
- Lower dealer margins, and
- A return to consumer value hunting.
Adding to this pressure is the further proliferation of Chinese brands entering the Australian market, all aggressively targeting market share at any cost.
Top sales October by region
| Country | Sales volume | % Change |
| Japan | 27,716 | -2.9% |
| Thailand | 20,811 | -5.5% |
| China | 20,405 | 32.5% |
| Korea | 12,455 | -9.1% |
| Germany | 4,928 | -1.3% |
Source: Cox Automotive
Chinese OEMs and sub-brands on-sale in Australia, or coming soon
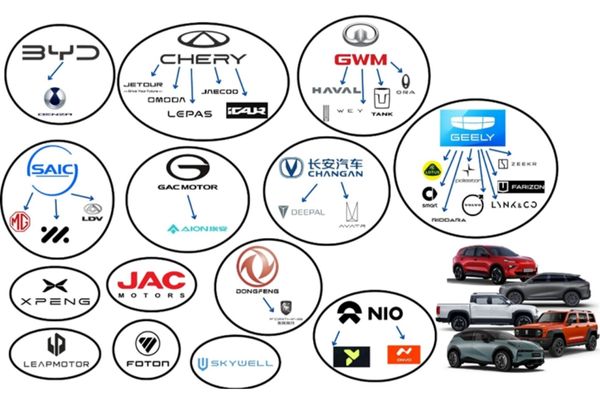
Source: Cox Automotive Australia
Australia already has 12 Chinese OEMs representing 26 brands, and this is expected to double in the next three to five years.
Many Chinese brands are not simply competing in the traditional new car entry-level segments, they are now coming after the top end of the used car market.
This shift was laid bare when the Managing Director of MG publicly stated that used cars in Australia are too expensive, and that consumers will increasingly favour cheaper new cars with warranties over high-priced used vehicles.
This mindset signals a strategic warning for the industry:
Chinese OEMs are not just here to participate, they are here to take volume from both sides of the market, new and used.
This trading environment will feel familiar to those who remember the “pre-RDA” era driven by aggressive OEM incentives, tactical discounting and the erosion of front-end gross as competition intensifies.
4. Consolidation will accelerate, but with complications
The listed and large private groups will continue to dominate M&A activity as seen in the graphic below.
Goodwill spent by Australian Listed Automotive Groups
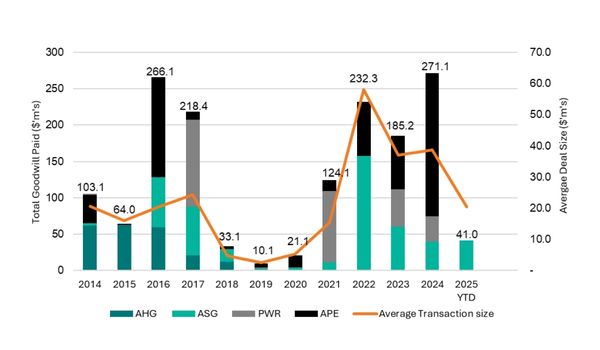
Source: Pitcher Partners Analysis compiled from publicly available information.
Notes:
- Australian Automotive Holdings group (AHG) ceased trading on the ASX 27 September 2019 after an on-market takeover by Eagers Automotive (APE)
- Autosports Group (ASG) IPO 16 November 2016
- Peter Warren Automotive Holdings (PWR) IPO 26 April 2021
- APE investment in Canada One is noted but not included as Goodwill figures are unavailable
Australian dealership landscape (by dealer group and rooftops)
| Dealer groups by number of rooftops | Number of owners in range | Percentage of owners | Total rooftops by range | Percentage of rooftops |
| 50+ | 7 | 0.9% | 908 | 25.6% |
| 26-50 | 4 | 0.5% | 141 | 4.0% |
| 11-25 | 47 | 6.2% | 730 | 20.6% |
| 6-10 | 83 | 11.0% | 631 | 17.8% |
| 1-5 | 616 | 81.4% | 1142 | 32.2% |
| Totals | 757 | 100.0% | 3552 | 100.0% |
Source: Pitcher Partners Analysis June 2025
Why? Because scale is now essential to survival and $3 billion turnover per group is the strategic benchmark that delivers resilience and bargaining power.
Throughput per dealership rooftop is too low for many brands (refer below a table showing brands selling less than 14 new cars per month per dealership) and consolidation is the only hope for dealers and their OEM partners to remain viable.
High-performing rooftops will change hands, but the regulatory burden will test the resolve of buyers.
Australia’s new vehicle dealer network
| Brand | Number of dealerships | Average vehicles sold per dealer | Total vehicles sold by brand |
| Toyota | 276 | 874 | 241,296 |
| Ford | 194 | 516 | 100,170 |
| Mazda | 141 | 681 | 95,987 |
| Kia | 144 | 568 | 81,787 |
| Mitsubishi | 189 | 394 | 74,547 |
| Hyundai | 166 | 432 | 71,664 |
| MG | 107 | 473 | 50,592 |
| Isuzu Ute | 155 | 311 | 48,172 |
| Nissan | 183 | 247 | 45,284 |
| GWM | 98 | 437 | 42,782 |
| Subaru | 119 | 341 | 40,604 |
| Volkswagen | 102 | 358 | 36,480 |
| BMW | 49 | 538 | 26,341 |
| Suzuki | 127 | 168 | 21,278 |
| BYD | 41 | 499 | 20,458 |
| Mercedes-Benz | 63 | 317 | 19,989 |
| LDV | 99 | 162 | 16,022 |
| Audi | 40 | 383 | 15,333 |
| Honda | 78 | 181 | 14,092 |
| Lexus | 29 | 470 | 13,642 |
Source: AADA Dealernomics 2025 – Automotive Statistics
But there is a twist, from 2026 onwards, heightened ACCC regulation will make deals more complex, slower and more expensive.
5. Fixed Ops is still the lowest hanging fruit to improve dealer profits
For too long, dealerships rode the wave of strong COVID-era front-end profits and neglected the back of house.
In 2026, we will continue to see substantial performance improvement, largely because operators are starting from a low base.
Service retention, workshop efficiency and parts margins will be the backbone of sustainable dealership profitability.
In 2025, Pitcher Partners has worked with several groups to assist in optimisation of their service department results, with significant uplifts experienced immediately.
The average dealer of groups worked with were currently losing ~$350 per month per tech based on data received.
Our clients on average post advisory grew net profit per technician by over $1,500 per month in labour sales alone (excluding parts profits) with many achieving far great improvements.
6. As profits tighten, fraud is re-emerging
Warren Buffett has said, “When the tide goes out, you get to see who’s swimming naked.” Similarly, whenever margins compress, fraud is often exposed.
Unfortunately, 2026 will see the continuation of more internal fraud cases emerging.
We are seeing some employees attempting to fill the gap left by declining dealership profits to their pay packages, leaving owners out-of-pocket.
Prevention is key!
Strong controls, segregation of duties and regular forensic reviews will shift from “good housekeeping” to “critical risk management” in 2026.
7. EV demand will stagnate while hybrids shine (for now)
BEV growth is slowing and will persist with anaemic improvements for the short term. BEV sales in 2026 declined and are flattening to around 8% of total new car sales.
Hybrids will remain the consumer favourite through 2026 thanks to their practicality, affordability and reliability.
But a storm is coming for hybrids:
Most hybrids will not comply with NVES targets starting in 2027 and 2028.
OEMs and dealers must prepare for a future where the very products consumers want (hybrids, petrol and diesel) are penalised by regulation.
8. Vehicle affordability will bite hard
Interest rates are forecasted to remain on hold or rise during 2026 which will further strain consumer confidence.
This will directly impact:
- Affordability,
- Transaction prices,
- The types of vehicles customers select, and
- The frequency at which they upgrade
As the wealth effect softens (home values negatively impacted by interest rate increases), some consumers will stretch their replacement cycles and shift down market.
The other side of the argument is the conclusion or question that new cars are over-priced now, or at least for many years (from ~2000 until 2020) new cars were under-priced. Covid provided a catalyst for OEMs to increase prices, and we are now at a divergence where only the wealthy will buy new cars, creating an opportunity for dealers to focus on the used car market.
9. Finance & Insurance will become critical for dealer’s survival
With margin pressure increasing and cost base increases baked in by high inflation, F&I income will become mission-critical for many dealers.
In some cases, it will be the difference between positive and negative profits before tax.
Dealers should be looking for other revenue streams in the vehicle sales process that can supplement the drop in gross margins. The best dealers focus on value added products such as service maintenance plans, wear and tear items maintenance programs and aftermarket accessories and products.
Dealers with disciplined sales processes, strong business managers and compliant yet commercial lending structures will outperform the field.
10. OEMs will begin to be forced to make hard calls on the Australian market
2026 is the beginning of a reckoning.
OEMs with small volumes, thin dealer networks or marginal profitability will need to decide whether Australia remains viable heading into 2027.
Hard decisions will be made around:
- Model Lines and Product portfolios,
- Market allocations,
- Dealer representation
- NVES penalties piling up, and
- Investment levels for the Australian automotive market.
Australia will remain an attractive market, but not for every brand and certainly not 80+ brands for a market of ~1.2 million new units.
Conclusion: 2026 will test strategy, leadership and discipline for the automotive industry
The year ahead will reward dealers and OEMs who demonstrate operational discipline, invest in their people, protect their culture, and maintain a relentless focus on the fundamentals.
The industry is not in decline. It is in transformation.
Those who adapt will thrive. Those who wait for the “old days” to return will not.